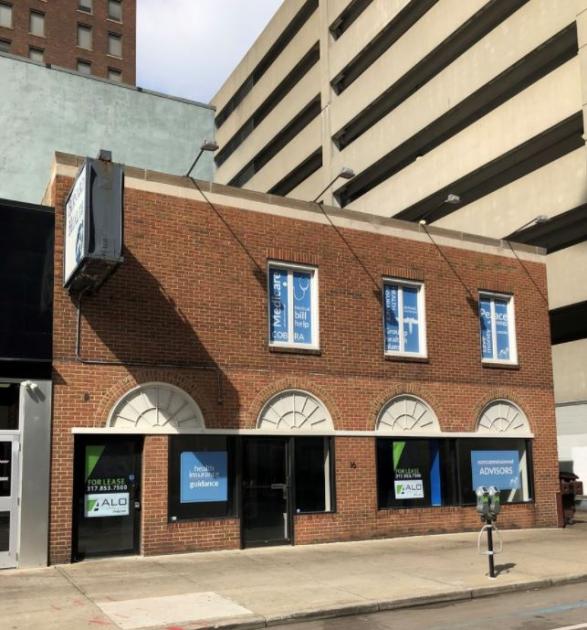
1-Mile | 3-Miles | 5-Miles | ||
---|---|---|---|---|
Total Population | 16,441 | 100,231 | 251,088 | |
Population Median Age | 36 | 35 | 35 | |
Population by Age | 0-9 Yrs | 366 (2%) | 12080 (12%) | 35079 (13%) |
10-19 Yrs | 675 (4%) | 11028 (11%) | 30969 (12%) | |
20-29 Yrs | 6644 (40%) | 23202 (23%) | 46927 (18%) | |
30-39 Yrs | 3703 (22%) | 17152 (17%) | 37918 (15%) | |
40-49 Yrs | 1486 (9%) | 10538 (10%) | 27236 (10%) | |
50-59 Yrs | 1609 (9%) | 12131 (12%) | 32010 (12%) | |
60-69 Yrs | 1395 (8%) | 8614 (8%) | 23539 (9%) | |
70+ Yrs | 562 (3%) | 5487 (5%) | 17410 (6%) | |
Median HH Income | $62,410 | $37,206 | $36,536 | |
Total Household Income | < 24K | 2124 (27%) | 14789 (35%) | 35306 (35%) |
25-49K | 992 (12%) | 10848 (26%) | 27345 (27%) | |
50-74K | 1519 (19%) | 6377 (15%) | 15405 (15%) | |
75-99K | 837 (10%) | 3499 (8%) | 8741 (8%) | |
100-199K | 1635 (21%) | 4565 (11%) | 9425 (9%) | |
200K+ | 557 (7%) | 1323 (3%) | 2537 (2%) | |
Highest Education Level | No Diploma | 1578 | 14880 | 34722 |
Diploma or GED | 1929 | 18358 | 51499 | |
Some College | 1446 | 10679 | 29008 | |
Assoc. Degree | 519 | 3688 | 10294 | |
Bachelors Degree | 4048 | 12516 | 24360 | |
Higher Degree | 3356 | 8058 | 14176 | |
Total Housing Units | 8,464 | 54,288 | 123,780 | |
--Owner-Occupied | 1,810 | 15,729 | 44,225 | |
--Renter-Occupied | 5,854 | 25,672 | 54,535 | |
Owner-Occupied Values | < 100K | 88 | 8316 | 25051 |
100-199K | 253 | 2898 | 11154 | |
200-299K | 448 | 1842 | 3790 | |
300-399K | 533 | 1321 | 1928 | |
400-499K | 205 | 585 | 854 | |
500K+ | 284 | 767 | 1448 | |
Total Working Age Population | 15,940 | 81,679 | 198,177 | |
In Work Force | 9,117 | 51,221 | 123,423 | |
Not In Work Force | 6,823 | 30,458 | 74,754 | |
Workforce Employed | 8,789 | 47,378 | 113,012 | |
Workforce Unemployed | 309 | 3,742 | 10,275 | |
Civlian Workforce | 9,098 | 51,120 | 123,286 | |
Military Workforce | 19 | 101 | 137 | |
Total Households | 7,664 | 41,402 | 98,760 | |
Family Households | 1,643 | 16,627 | 45,938 | |
Non-Family Households | 6,021 | 24,775 | 52,822 | |
Married Couple | 1,428 | 9,430 | 24,677 | |
Other Family | 215 | 7,197 | 21,261 | |
Married w/Child | 221 | 3,331 | 9,116 | |
Single Male w/Child | 20 | 818 | 2,831 | |
Single Female w/Child | 82 | 2,935 | 8,754 |
Population Change Last Two Decades - Plus Projection
2000 | % | 2010 | % | 2020 | % | 2030 | |
---|---|---|---|---|---|---|---|
Indiana | 6,080,485 | +7 | 6,483,802 | +4 | 6,738,573 | +4 | 7,014,880 |
Marion County | 860,454 | +5 | 903,393 | +7 | 963,732 | +4 | 1,001,231 |
Total Working Age Population:
Total Households:
Total Working Age Population:
Total Households:
Total Working Age Population:
Total Households: