Office Space
1059 Virginia Avenue Indianapolis, IN 46203
1059 Virginia Avenue Indianapolis, IN 46203

Details & Description
Property Highlights
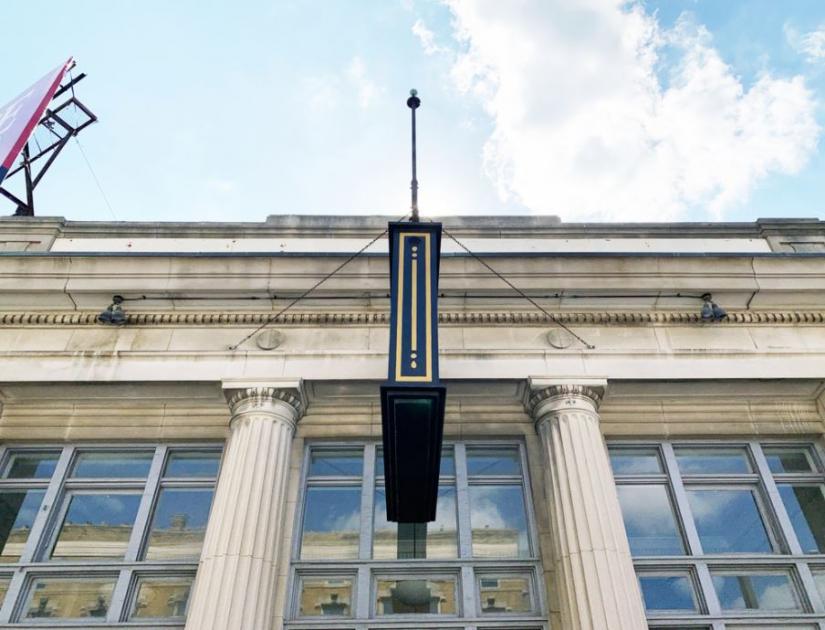
- • Prominent building signage available.
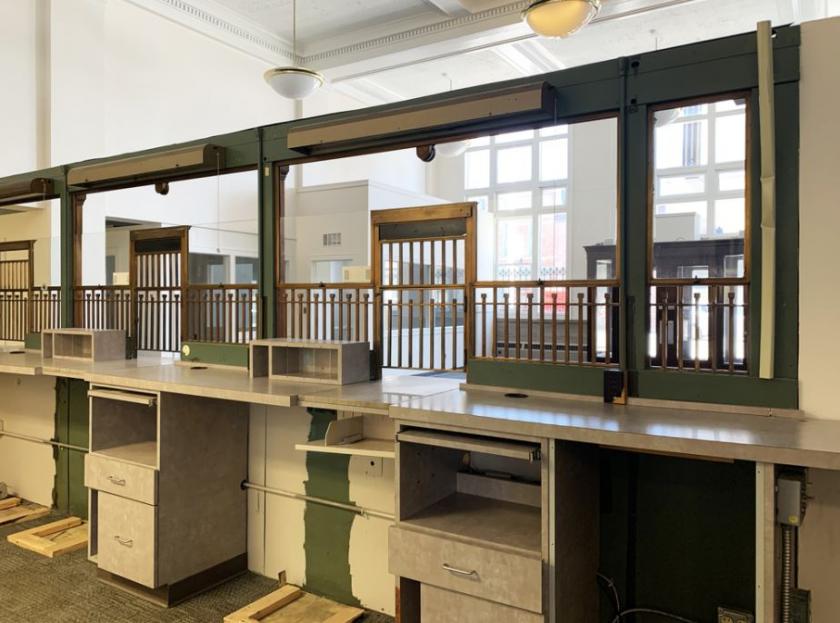
- • 1920s architectural details throughout.
- • 19 tall ceilings.
Additional Photos

Listing Agents

Alison Melton
O: 317-414-2547
alison@roecommercial.com
O: 317-414-2547
alison@roecommercial.com
While we strive to provide the most accurate information, all listing information, and demographic data, is provided by third-parties. As such, MyEListing will not be responsible for the accuracy of the information. It is strongly recommended that you verify all information with the listing agent, and any relevant agencies, prior to making any decisions.


