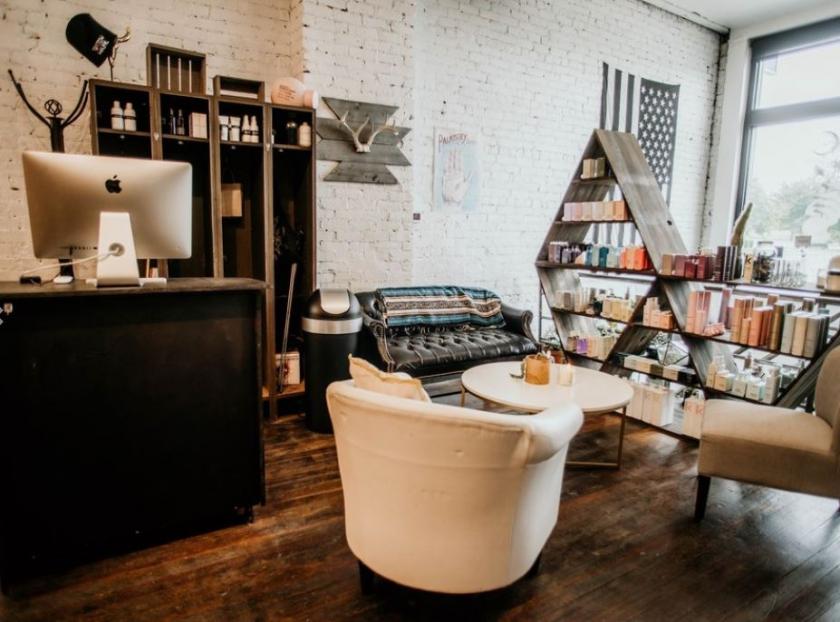
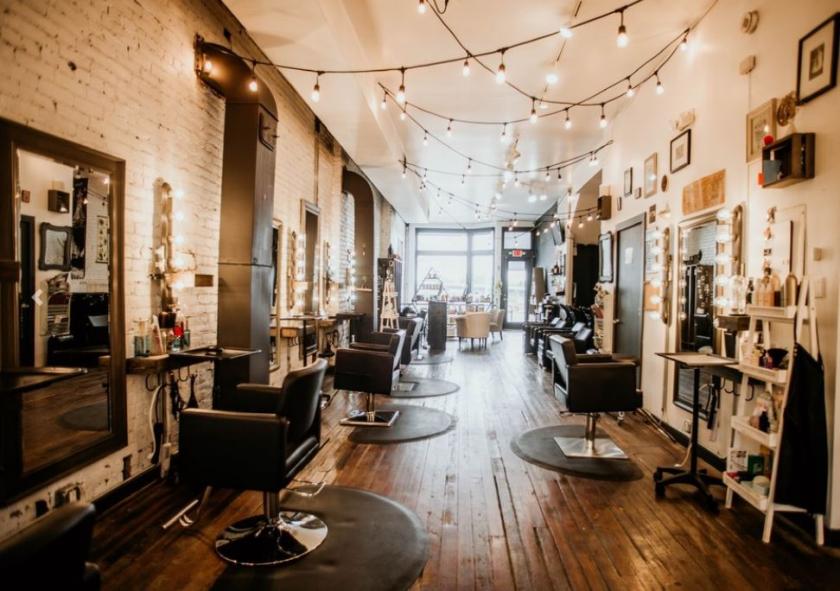
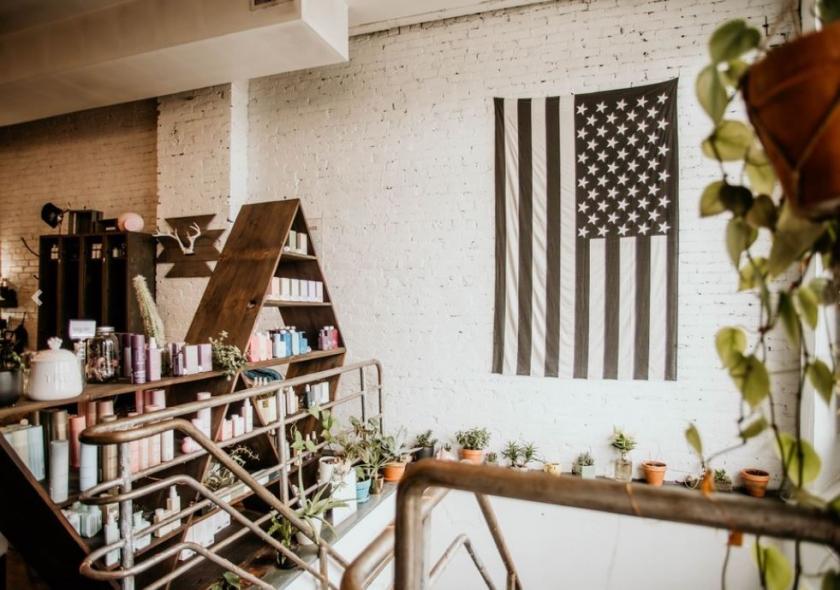
1-Mile | 3-Miles | 5-Miles | ||
---|---|---|---|---|
Total Population | 15,554 | 100,041 | 244,448 | |
Population Median Age | 36 | 36 | 36 | |
Population by Age | 0-9 Yrs | 1441 (9%) | 11634 (11%) | 33666 (13%) |
10-19 Yrs | 1186 (7%) | 10593 (10%) | 28828 (11%) | |
20-29 Yrs | 4262 (27%) | 22143 (22%) | 44649 (18%) | |
30-39 Yrs | 3222 (20%) | 17141 (17%) | 37565 (15%) | |
40-49 Yrs | 1608 (10%) | 10400 (10%) | 27164 (11%) | |
50-59 Yrs | 1672 (10%) | 12943 (12%) | 31354 (12%) | |
60-69 Yrs | 1395 (8%) | 9113 (9%) | 23708 (9%) | |
70+ Yrs | 768 (4%) | 6074 (6%) | 17514 (7%) | |
Median HH Income | $47,037 | $36,946 | $36,754 | |
Total Household Income | < 24K | 1679 (30%) | 14940 (36%) | 34609 (35%) |
25-49K | 1227 (22%) | 10527 (25%) | 27243 (27%) | |
50-74K | 910 (16%) | 6334 (15%) | 15639 (15%) | |
75-99K | 495 (8%) | 3721 (8%) | 8710 (8%) | |
100-199K | 1008 (18%) | 4715 (11%) | 9597 (9%) | |
200K+ | 250 (4%) | 1228 (2%) | 2149 (2%) | |
Highest Education Level | No Diploma | 2511 | 15126 | 33917 |
Diploma or GED | 3072 | 20313 | 52850 | |
Some College | 1563 | 10566 | 29004 | |
Assoc. Degree | 616 | 3760 | 9975 | |
Bachelors Degree | 2374 | 11886 | 23919 | |
Higher Degree | 1403 | 7503 | 13074 | |
Total Housing Units | 7,851 | 52,740 | 121,894 | |
--Owner-Occupied | 2,544 | 16,581 | 44,236 | |
--Renter-Occupied | 3,025 | 24,884 | 53,712 | |
Owner-Occupied Values | < 100K | 909 | 9289 | 24204 |
100-199K | 626 | 3243 | 13043 | |
200-299K | 487 | 1646 | 3527 | |
300-399K | 347 | 1222 | 1610 | |
400-499K | 85 | 467 | 716 | |
500K+ | 90 | 714 | 1135 | |
Total Working Age Population | 13,515 | 82,080 | 193,573 | |
In Work Force | 7,256 | 51,072 | 120,355 | |
Not In Work Force | 6,259 | 31,008 | 73,218 | |
Workforce Employed | 6,859 | 47,039 | 110,579 | |
Workforce Unemployed | 397 | 3,983 | 9,661 | |
Civlian Workforce | 7,256 | 51,022 | 120,240 | |
Military Workforce | 0 | 50 | 115 | |
Total Households | 5,569 | 41,465 | 97,948 | |
Family Households | 2,224 | 16,690 | 45,206 | |
Non-Family Households | 3,345 | 24,775 | 52,742 | |
Married Couple | 1,402 | 9,746 | 25,110 | |
Other Family | 822 | 6,944 | 20,096 | |
Married w/Child | 377 | 3,182 | 9,175 | |
Single Male w/Child | 118 | 779 | 2,718 | |
Single Female w/Child | 251 | 2,999 | 8,177 |
Population Change Last Two Decades - Plus Projection
2000 | % | 2010 | % | 2020 | % | 2030 | |
---|---|---|---|---|---|---|---|
Indiana | 6,080,485 | +7 | 6,483,802 | +4 | 6,738,573 | +4 | 7,014,880 |
Marion County | 860,454 | +5 | 903,393 | +7 | 963,732 | +4 | 1,001,231 |
Total Working Age Population:
Total Households:
Total Working Age Population:
Total Households:
Total Working Age Population:
Total Households: