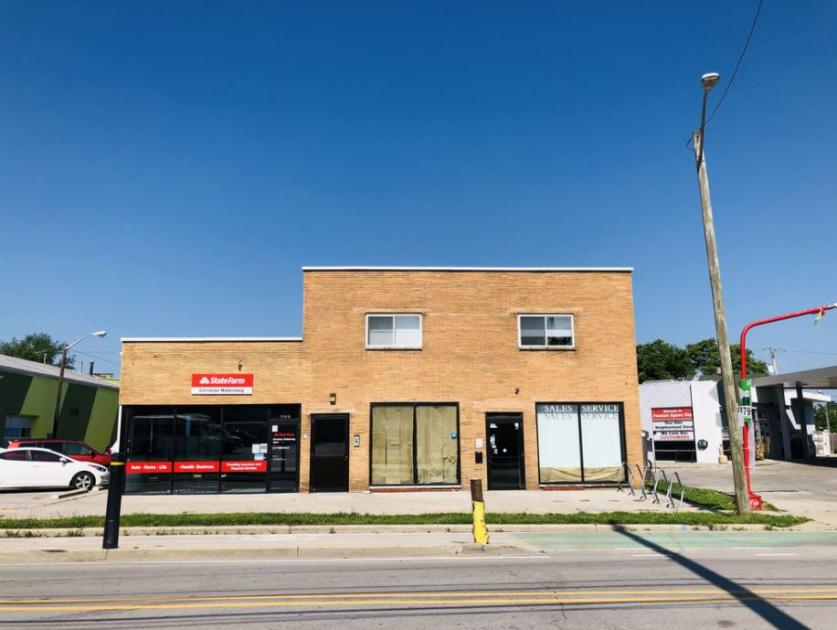
Retail Space
1354 Shelby Street Indianapolis, IN 46203
1354 Shelby Street Indianapolis, IN 46203
Details & Description
Property Highlights
- • -3,978 SF
- • Street Retail
- • Overhead Door
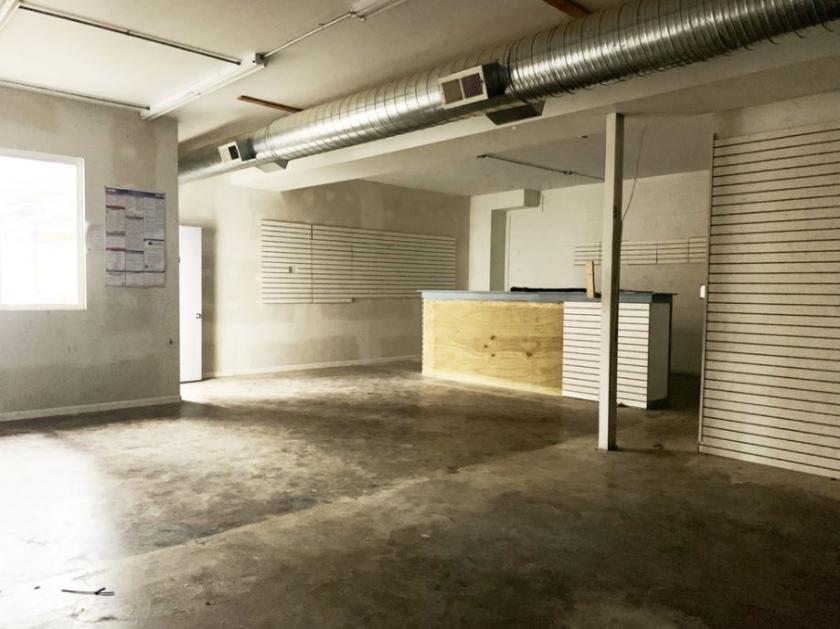
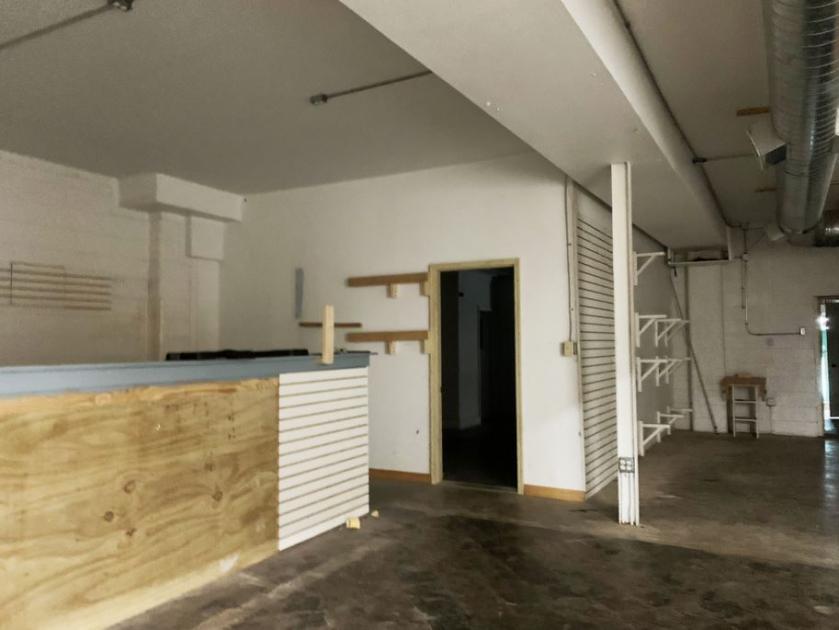
- • Large Back of House Work Area
- • Exposed Concrete Floors
Additional Photos

Listing Agents

Alison Melton
O: 317-414-2547
alison@roecommercial.com
O: 317-414-2547
alison@roecommercial.com
While we strive to provide the most accurate information, all listing information, and demographic data, is provided by third-parties. As such, MyEListing will not be responsible for the accuracy of the information. It is strongly recommended that you verify all information with the listing agent, and any relevant agencies, prior to making any decisions.


