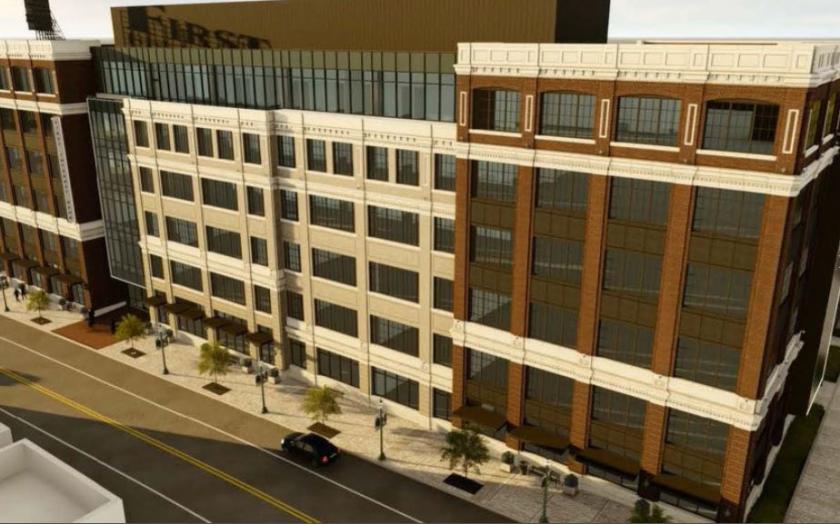
1-Mile | 3-Miles | 5-Miles | ||
---|---|---|---|---|
Total Population | 10,558 | 65,530 | 166,523 | |
Population Median Age | 34 | 37 | 37 | |
Population by Age | 0-9 Yrs | 1284 (12%) | 8436 (12%) | 21443 (12%) |
10-19 Yrs | 1653 (15%) | 9670 (14%) | 23744 (14%) | |
20-29 Yrs | 1673 (15%) | 8051 (12%) | 20606 (12%) | |
30-39 Yrs | 1961 (18%) | 9630 (14%) | 24118 (14%) | |
40-49 Yrs | 1443 (13%) | 9845 (15%) | 24518 (14%) | |
50-59 Yrs | 1397 (13%) | 9830 (15%) | 23181 (13%) | |
60-69 Yrs | 658 (6%) | 5650 (8%) | 16312 (9%) | |
70+ Yrs | 490 (4%) | 4419 (6%) | 12600 (7%) | |
Median HH Income | $86,008 | $96,955 | $95,936 | |
Total Household Income | < 24K | 258 (6%) | 1584 (6%) | 4939 (7%) |
25-49K | 764 (17%) | 3691 (14%) | 10292 (15%) | |
50-74K | 781 (18%) | 4084 (15%) | 10046 (15%) | |
75-99K | 766 (17%) | 4011 (15%) | 8774 (13%) | |
100-199K | 1418 (33%) | 9077 (35%) | 21412 (32%) | |
200K+ | 293 (6%) | 3316 (12%) | 9788 (15%) | |
Highest Education Level | No Diploma | 152 | 766 | 2551 |
Diploma or GED | 869 | 5038 | 13685 | |
Some College | 1103 | 6798 | 17030 | |
Assoc. Degree | 700 | 2975 | 7637 | |
Bachelors Degree | 2709 | 18179 | 45352 | |
Higher Degree | 1389 | 9965 | 25911 | |
Total Housing Units | 4,417 | 26,719 | 68,054 | |
--Owner-Occupied | 2,467 | 18,601 | 46,815 | |
--Renter-Occupied | 1,814 | 7,161 | 18,437 | |
Owner-Occupied Values | < 100K | 82 | 360 | 1085 |
100-199K | 1312 | 6597 | 13527 | |
200-299K | 832 | 6098 | 13999 | |
300-399K | 174 | 3122 | 9490 | |
400-499K | 29 | 1271 | 4431 | |
500K+ | 39 | 1154 | 4282 | |
Total Working Age Population | 8,217 | 50,483 | 128,979 | |
In Work Force | 6,521 | 38,097 | 95,704 | |
Not In Work Force | 1,696 | 12,386 | 33,275 | |
Workforce Employed | 6,297 | 36,917 | 92,676 | |
Workforce Unemployed | 224 | 1,110 | 2,823 | |
Civlian Workforce | 6,521 | 38,027 | 95,498 | |
Military Workforce | 0 | 70 | 206 | |
Total Households | 4,280 | 25,762 | 65,252 | |
Family Households | 2,717 | 17,502 | 43,704 | |
Non-Family Households | 1,564 | 8,261 | 21,548 | |
Married Couple | 2,152 | 14,390 | 36,784 | |
Other Family | 565 | 3,112 | 6,920 | |
Married w/Child | 1,089 | 7,224 | 17,623 | |
Single Male w/Child | 91 | 696 | 1,337 | |
Single Female w/Child | 320 | 1,382 | 3,076 |
Population Change Last Two Decades - Plus Projection
2000 | % | 2010 | % | 2020 | % | 2030 | |
---|---|---|---|---|---|---|---|
Indiana | 6,080,485 | +7 | 6,483,802 | +4 | 6,738,573 | +4 | 7,014,880 |
Hamilton County | 182,740 | +50 | 274,569 | +25 | 343,179 | +22 | 417,754 |
Hancock County | 55,391 | +26 | 70,002 | +9 | 76,353 | +11 | 85,043 |
Marion County | 860,454 | +5 | 903,393 | +7 | 963,732 | +4 | 1,001,231 |
Total Working Age Population:
Total Households:
Total Working Age Population:
Total Households:
Total Working Age Population:
Total Households: