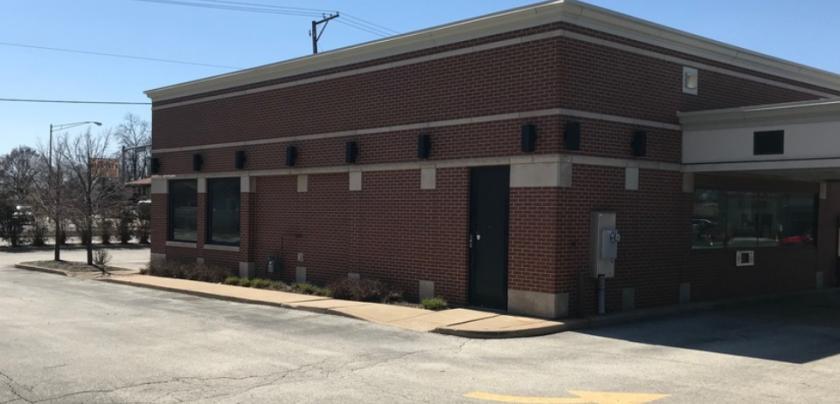
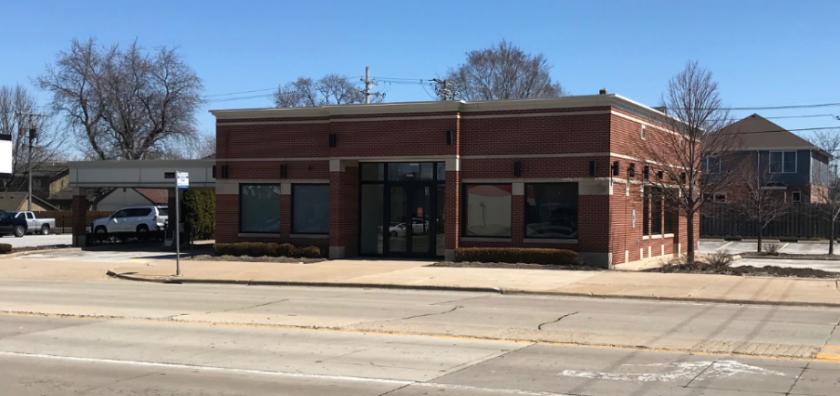
1-Mile | 3-Miles | 5-Miles | ||
---|---|---|---|---|
Total Population | 18,595 | 130,227 | 306,629 | |
Population Median Age | 38 | 40 | 39 | |
Population by Age | 0-9 Yrs | 2800 (15%) | 16531 (12%) | 39029 (12%) |
10-19 Yrs | 1905 (10%) | 15630 (12%) | 39235 (12%) | |
20-29 Yrs | 2941 (15%) | 15961 (12%) | 38072 (12%) | |
30-39 Yrs | 2836 (15%) | 17901 (13%) | 40047 (13%) | |
40-49 Yrs | 1861 (10%) | 14743 (11%) | 36927 (12%) | |
50-59 Yrs | 2314 (12%) | 18084 (13%) | 42155 (13%) | |
60-69 Yrs | 2173 (11%) | 16618 (12%) | 37462 (12%) | |
70+ Yrs | 1766 (9%) | 14760 (11%) | 33701 (10%) | |
Median HH Income | $49,342 | $61,978 | $66,305 | |
Total Household Income | < 24K | 1595 (22%) | 8227 (17%) | 18377 (16%) |
25-49K | 2015 (28%) | 11291 (23%) | 23778 (21%) | |
50-74K | 1359 (19%) | 8827 (18%) | 19982 (17%) | |
75-99K | 854 (11%) | 6530 (13%) | 15891 (14%) | |
100-199K | 1222 (17%) | 11246 (23%) | 27104 (24%) | |
200K+ | 77 (1%) | 2070 (4%) | 6148 (5%) | |
Highest Education Level | No Diploma | 1336 | 9542 | 23078 |
Diploma or GED | 4677 | 27997 | 62514 | |
Some College | 3178 | 20917 | 49600 | |
Assoc. Degree | 1221 | 8693 | 18416 | |
Bachelors Degree | 1581 | 15466 | 36568 | |
Higher Degree | 685 | 8068 | 19939 | |
Total Housing Units | 7,767 | 51,541 | 119,346 | |
--Owner-Occupied | 4,135 | 35,663 | 84,340 | |
--Renter-Occupied | 2,987 | 12,528 | 26,940 | |
Owner-Occupied Values | < 100K | 885 | 4790 | 9877 |
100-199K | 1914 | 12590 | 31232 | |
200-299K | 1046 | 12908 | 29274 | |
300-399K | 231 | 3720 | 9268 | |
400-499K | 4 | 1036 | 2682 | |
500K+ | 55 | 619 | 2008 | |
Total Working Age Population | 14,709 | 104,329 | 243,856 | |
In Work Force | 8,833 | 64,030 | 153,483 | |
Not In Work Force | 5,876 | 40,299 | 90,373 | |
Workforce Employed | 8,253 | 60,150 | 143,884 | |
Workforce Unemployed | 580 | 3,826 | 9,530 | |
Civlian Workforce | 8,833 | 63,976 | 153,414 | |
Military Workforce | 0 | 54 | 69 | |
Total Households | 7,122 | 48,191 | 111,281 | |
Family Households | 4,483 | 31,855 | 74,551 | |
Non-Family Households | 2,639 | 16,336 | 36,729 | |
Married Couple | 3,270 | 23,551 | 54,866 | |
Other Family | 1,213 | 8,304 | 19,685 | |
Married w/Child | 1,339 | 9,469 | 22,494 | |
Single Male w/Child | 139 | 982 | 2,565 | |
Single Female w/Child | 429 | 2,401 | 5,576 |
Population Change Last Two Decades - Plus Projection
2000 | % | 2010 | % | 2020 | % | 2030 | |
---|---|---|---|---|---|---|---|
Illinois | 12,419,293 | +3 | 12,830,632 | +12 | 14,316,487 | +6 | 15,138,849 |
Cook County | 5,376,741 | -3 | 5,194,675 | +10 | 5,707,832 | +5 | 5,990,243 |
Will County | 502,266 | +35 | 677,560 | +34 | 907,625 | +20 | 1,093,207 |
Total Working Age Population:
Total Households:
Total Working Age Population:
Total Households:
Total Working Age Population:
Total Households: