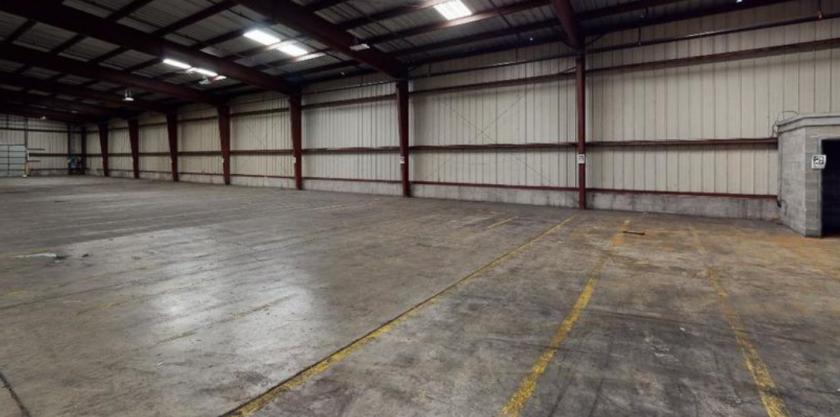
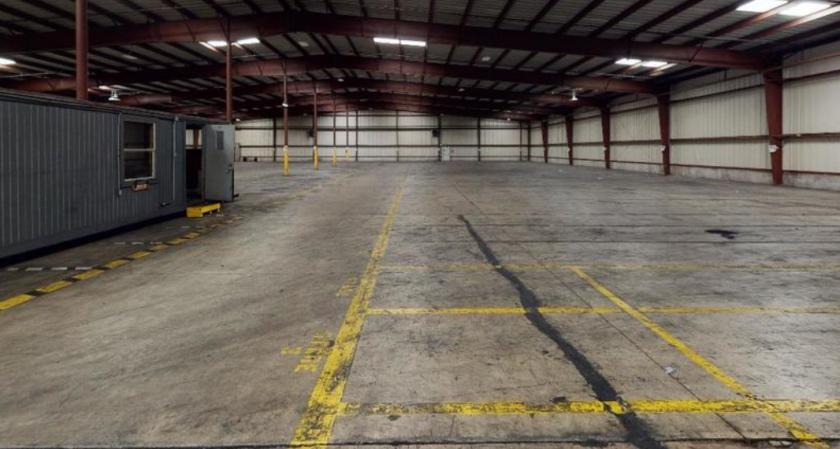
Industrial Properties
3710 South California Avenue Chicago, IL 60632
3710 South California Avenue Chicago, IL 60632
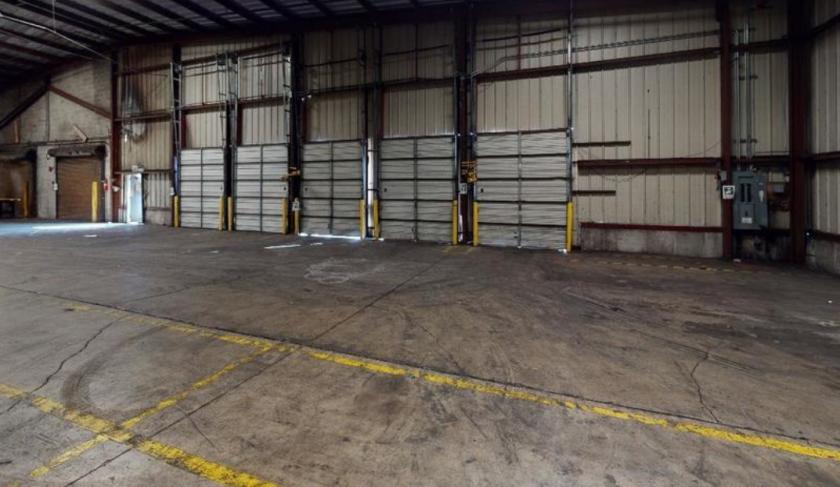
Details & Description
Property Highlights
- • Significant trailer parking or outside storage
- • Last Mile Opportunity
- • Close proximity to Intermodal Yards
- • Land is divisible
Listing Agents

Terry Lynch
O: 773-714-2142
M: 847-271-7550
tlynch@darwinpw.com
O: 773-714-2142
M: 847-271-7550
tlynch@darwinpw.com

Edward Wabick
O: 773-714-2141
M: 708-220-5539
ewabick@darwinpw.com
O: 773-714-2141
M: 708-220-5539
ewabick@darwinpw.com

Marc Hale
O: 773-714-2119
M: 312-722-1435
mhale@darwinpw.com
O: 773-714-2119
M: 312-722-1435
mhale@darwinpw.com
While we strive to provide the most accurate information, all listing information, and demographic data, is provided by third-parties. As such, MyEListing will not be responsible for the accuracy of the information. It is strongly recommended that you verify all information with the listing agent, and any relevant agencies, prior to making any decisions.