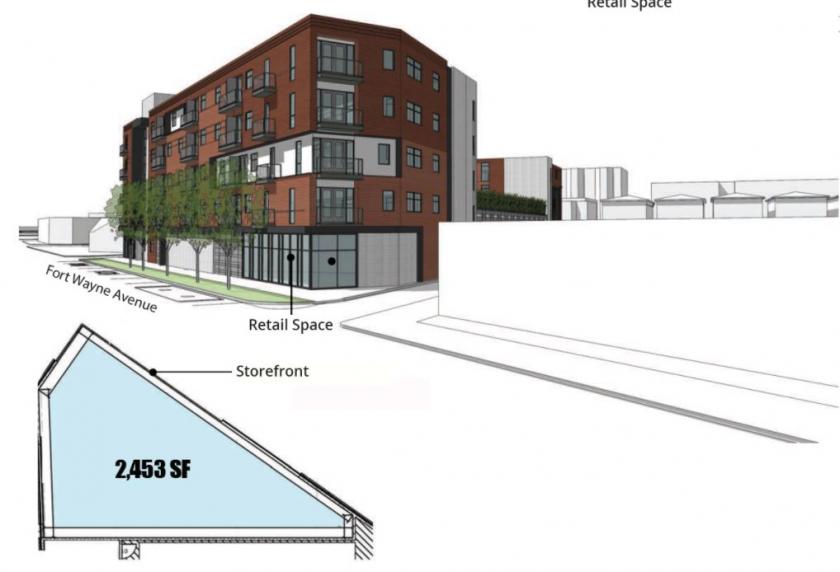
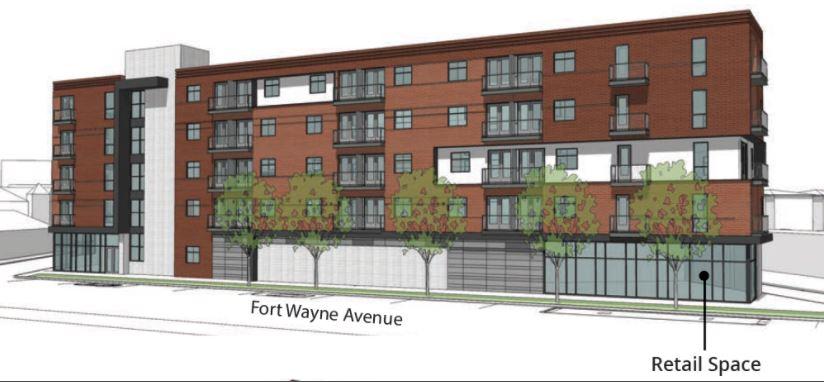
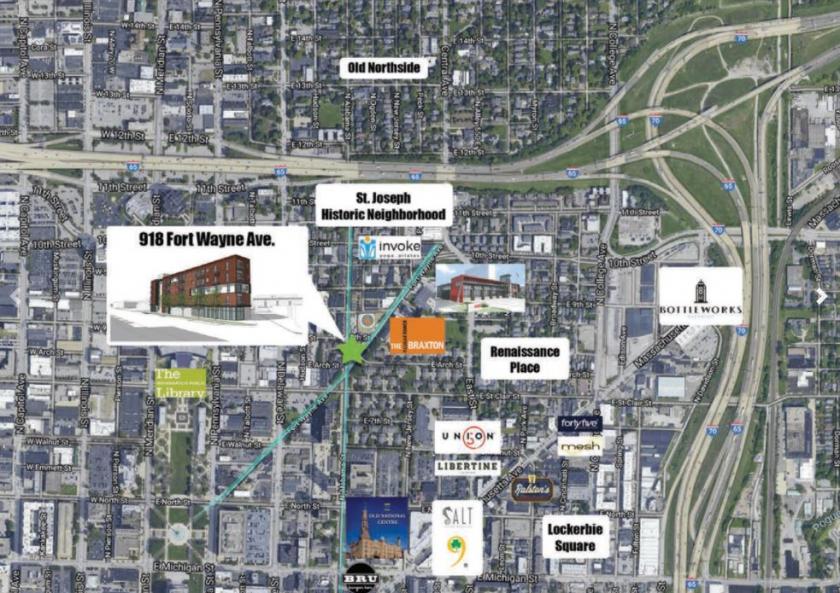
1-Mile | 3-Miles | 5-Miles | ||
---|---|---|---|---|
Total Population | 18,491 | 106,930 | 259,264 | |
Population Median Age | 37 | 35 | 36 | |
Population by Age | 0-9 Yrs | 762 (4%) | 13123 (12%) | 35629 (13%) |
10-19 Yrs | 550 (2%) | 11700 (10%) | 31750 (12%) | |
20-29 Yrs | 6962 (37%) | 24873 (23%) | 48354 (18%) | |
30-39 Yrs | 3744 (20%) | 17721 (16%) | 39400 (15%) | |
40-49 Yrs | 1728 (9%) | 11253 (10%) | 28256 (10%) | |
50-59 Yrs | 2245 (12%) | 12826 (11%) | 32807 (12%) | |
60-69 Yrs | 1688 (9%) | 9133 (8%) | 24614 (9%) | |
70+ Yrs | 811 (4%) | 6300 (5%) | 18453 (7%) | |
Median HH Income | $53,333 | $34,722 | $37,247 | |
Total Household Income | < 24K | 2994 (30%) | 17032 (37%) | 36497 (35%) |
25-49K | 1661 (16%) | 11468 (25%) | 27942 (27%) | |
50-74K | 1711 (17%) | 6670 (14%) | 15848 (15%) | |
75-99K | 939 (9%) | 3533 (7%) | 9446 (9%) | |
100-199K | 1817 (18%) | 4777 (10%) | 10528 (10%) | |
200K+ | 702 (7%) | 1356 (3%) | 3128 (3%) | |
Highest Education Level | No Diploma | 1426 | 14869 | 34359 |
Diploma or GED | 2091 | 19650 | 51250 | |
Some College | 1977 | 11783 | 29834 | |
Assoc. Degree | 735 | 4257 | 10870 | |
Bachelors Degree | 4742 | 13179 | 27290 | |
Higher Degree | 3709 | 8482 | 16614 | |
Total Housing Units | 11,325 | 59,339 | 129,345 | |
--Owner-Occupied | 2,648 | 16,361 | 46,304 | |
--Renter-Occupied | 7,176 | 28,475 | 57,085 | |
Owner-Occupied Values | < 100K | 137 | 8463 | 24707 |
100-199K | 425 | 3190 | 11859 | |
200-299K | 629 | 1884 | 4469 | |
300-399K | 725 | 1356 | 2387 | |
400-499K | 255 | 626 | 1081 | |
500K+ | 477 | 842 | 1801 | |
Total Working Age Population | 17,539 | 87,135 | 205,737 | |
In Work Force | 11,590 | 54,577 | 129,536 | |
Not In Work Force | 5,948 | 32,559 | 76,201 | |
Workforce Employed | 11,118 | 49,860 | 118,254 | |
Workforce Unemployed | 448 | 4,618 | 11,143 | |
Civlian Workforce | 11,566 | 54,477 | 129,397 | |
Military Workforce | 24 | 100 | 140 | |
Total Households | 9,824 | 44,836 | 103,390 | |
Family Households | 2,305 | 17,602 | 47,361 | |
Non-Family Households | 7,519 | 27,234 | 56,029 | |
Married Couple | 1,899 | 9,544 | 25,796 | |
Other Family | 406 | 8,058 | 21,565 | |
Married w/Child | 340 | 3,174 | 9,378 | |
Single Male w/Child | 55 | 816 | 2,654 | |
Single Female w/Child | 153 | 3,359 | 9,215 |
Population Change Last Two Decades - Plus Projection
2000 | % | 2010 | % | 2020 | % | 2030 | |
---|---|---|---|---|---|---|---|
Indiana | 6,080,485 | +7 | 6,483,802 | +4 | 6,738,573 | +4 | 7,014,880 |
Marion County | 860,454 | +5 | 903,393 | +7 | 963,732 | +4 | 1,001,231 |
Total Working Age Population:
Total Households:
Total Working Age Population:
Total Households:
Total Working Age Population:
Total Households: