Industrial Properties
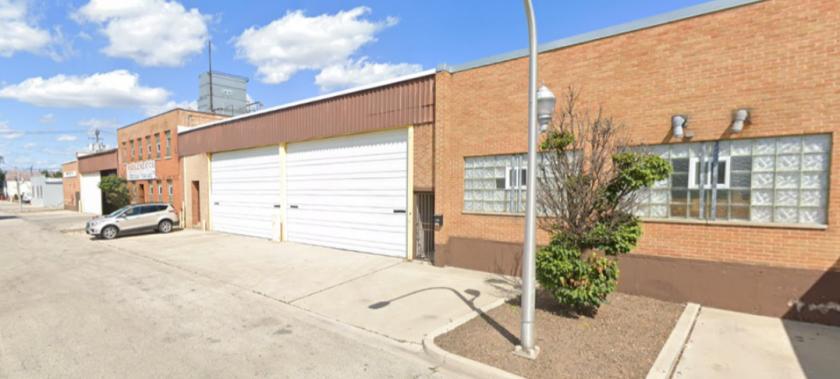
4725 South Talman Avenue Chicago, IL 60632
4725 South Talman Avenue Chicago, IL 60632
Details & Description
Property Highlights
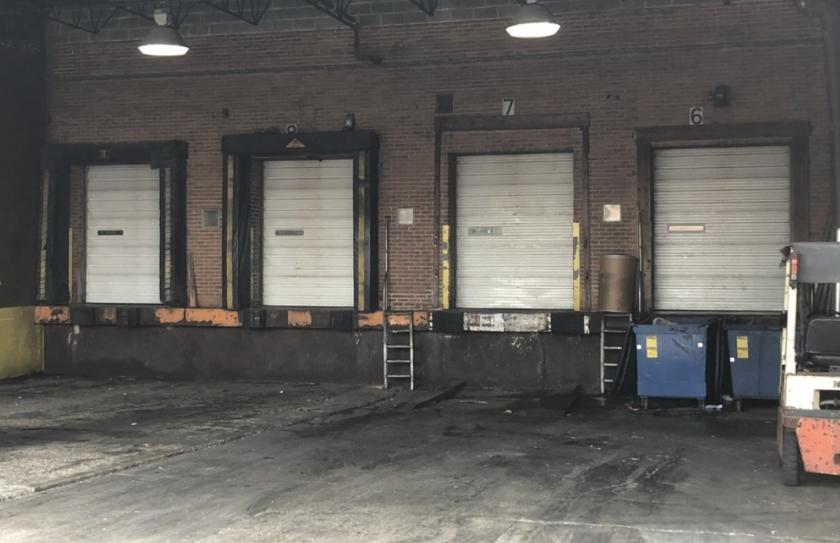
- • Hard-to-find food building, USDA certified
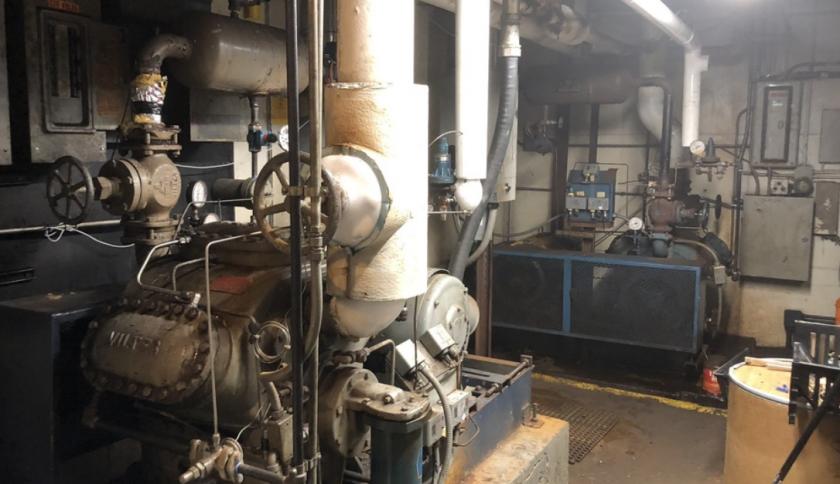
- • Cooler, freezer, process areas
- • Strong labor force
- • Income in place
- • Sprinklered
Listing Agents

Jim Cummings
O: 773-714-2149
M: 773-817-0123
jcummings@painewetzel.com
O: 773-714-2149
M: 773-817-0123
jcummings@painewetzel.com

Edward Wabick
O: 773-714-2141
M: 708-220-5539
ewabick@darwinpw.com
O: 773-714-2141
M: 708-220-5539
ewabick@darwinpw.com
While we strive to provide the most accurate information, all listing information, and demographic data, is provided by third-parties. As such, MyEListing will not be responsible for the accuracy of the information. It is strongly recommended that you verify all information with the listing agent, and any relevant agencies, prior to making any decisions.