Industrial Properties
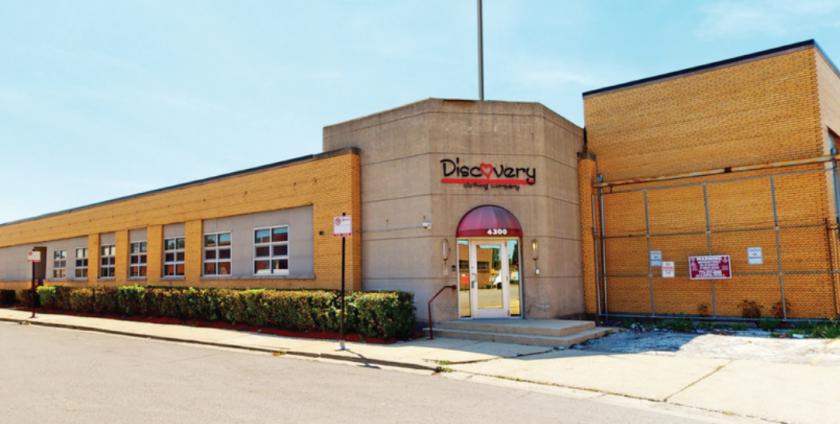
4300 North Knox Avenue Chicago, IL 60641
4300 North Knox Avenue Chicago, IL 60641
Details & Description
Property Highlights
- • Rare stand-alone building on Chicagos North side
- • Dedicated parking lot
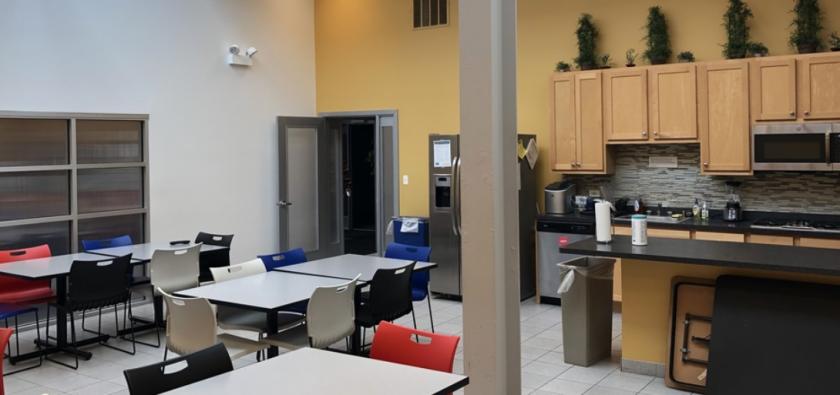
- • High-end office finishes
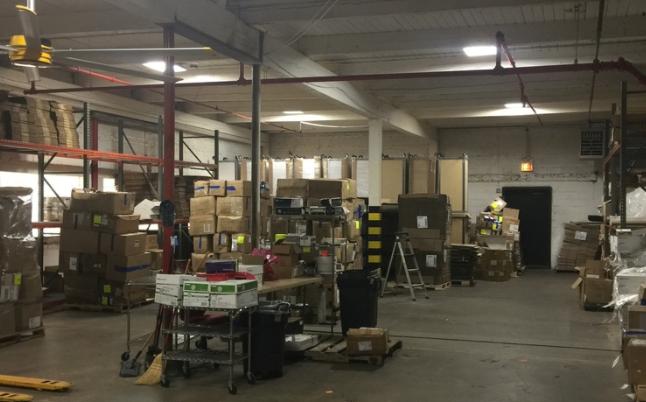
Additional Photos


Listing Agents

Jim Cummings
O: 773-714-2149
M: 773-817-0123
jcummings@painewetzel.com
O: 773-714-2149
M: 773-817-0123
jcummings@painewetzel.com

Terry Lynch
O: 773-714-2142
M: 847-271-7550
tlynch@darwinpw.com
O: 773-714-2142
M: 847-271-7550
tlynch@darwinpw.com

Sean Sloan
TCN Worldwide RES
O: 312-399-2245
M: 312-399-2245
ssloan@painewetzel.com
TCN Worldwide RES
O: 312-399-2245
M: 312-399-2245
ssloan@painewetzel.com
While we strive to provide the most accurate information, all listing information, and demographic data, is provided by third-parties. As such, MyEListing will not be responsible for the accuracy of the information. It is strongly recommended that you verify all information with the listing agent, and any relevant agencies, prior to making any decisions.


