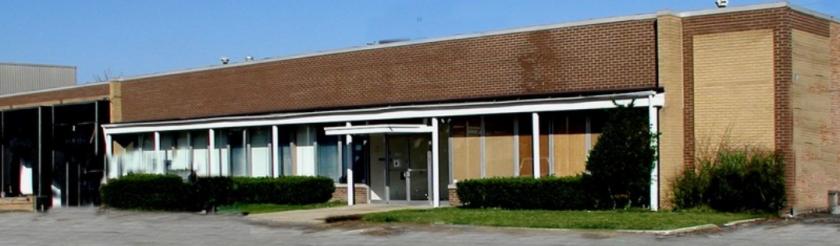
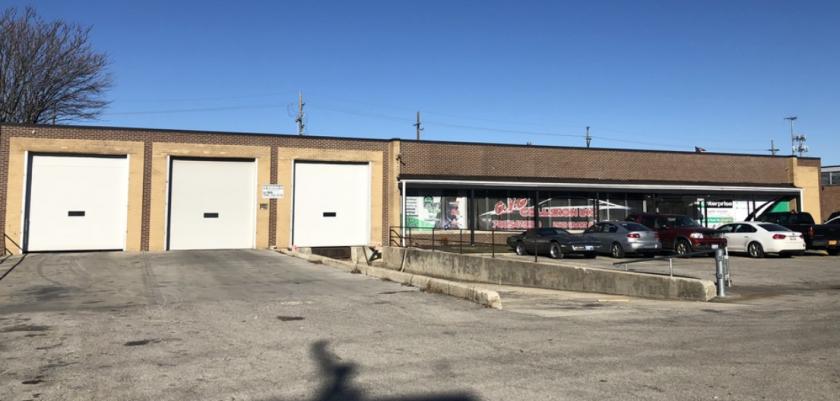
1-Mile | 3-Miles | 5-Miles | ||
---|---|---|---|---|
Total Population | 25,635 | 148,117 | 458,156 | |
Population Median Age | 35 | 38 | 39 | |
Population by Age | 0-9 Yrs | 3946 (15%) | 19359 (13%) | 58143 (12%) |
10-19 Yrs | 3558 (13%) | 18482 (12%) | 57575 (12%) | |
20-29 Yrs | 3533 (13%) | 19867 (13%) | 56293 (12%) | |
30-39 Yrs | 4275 (16%) | 20986 (14%) | 62564 (13%) | |
40-49 Yrs | 3292 (12%) | 19335 (13%) | 62265 (13%) | |
50-59 Yrs | 2476 (9%) | 19847 (13%) | 63809 (13%) | |
60-69 Yrs | 2485 (9%) | 15811 (10%) | 51467 (11%) | |
70+ Yrs | 2070 (8%) | 14430 (9%) | 46041 (10%) | |
Median HH Income | $53,556 | $61,815 | $71,900 | |
Total Household Income | < 24K | 1710 (21%) | 9383 (18%) | 28367 (17%) |
25-49K | 2066 (25%) | 11458 (22%) | 31075 (18%) | |
50-74K | 1605 (19%) | 9047 (17%) | 26009 (15%) | |
75-99K | 1299 (16%) | 7006 (13%) | 22597 (13%) | |
100-199K | 1207 (15%) | 10705 (21%) | 41300 (25%) | |
200K+ | 147 (1%) | 2792 (5%) | 15700 (9%) | |
Highest Education Level | No Diploma | 3901 | 17389 | 39650 |
Diploma or GED | 5733 | 31416 | 79707 | |
Some College | 3472 | 21394 | 61207 | |
Assoc. Degree | 1308 | 7677 | 23230 | |
Bachelors Degree | 1509 | 14584 | 63885 | |
Higher Degree | 609 | 8492 | 47116 | |
Total Housing Units | 9,131 | 54,878 | 178,622 | |
--Owner-Occupied | 4,228 | 34,125 | 110,668 | |
--Renter-Occupied | 3,806 | 16,266 | 54,381 | |
Owner-Occupied Values | < 100K | 585 | 3893 | 7694 |
100-199K | 2529 | 15664 | 30144 | |
200-299K | 799 | 8922 | 32642 | |
300-399K | 228 | 2496 | 17626 | |
400-499K | 16 | 866 | 8314 | |
500K+ | 72 | 2284 | 14248 | |
Total Working Age Population | 19,536 | 117,391 | 364,636 | |
In Work Force | 12,936 | 77,547 | 243,299 | |
Not In Work Force | 6,600 | 39,844 | 121,337 | |
Workforce Employed | 12,072 | 72,103 | 229,419 | |
Workforce Unemployed | 864 | 5,432 | 13,711 | |
Civlian Workforce | 12,936 | 77,535 | 243,129 | |
Military Workforce | 0 | 12 | 170 | |
Total Households | 8,033 | 50,391 | 165,049 | |
Family Households | 5,553 | 34,237 | 110,355 | |
Non-Family Households | 2,481 | 16,154 | 54,694 | |
Married Couple | 3,173 | 22,116 | 78,425 | |
Other Family | 2,380 | 12,122 | 31,930 | |
Married w/Child | 1,474 | 8,975 | 33,755 | |
Single Male w/Child | 294 | 1,381 | 3,658 | |
Single Female w/Child | 880 | 3,441 | 9,979 |
Population Change Last Two Decades - Plus Projection
2000 | % | 2010 | % | 2020 | % | 2030 | |
---|---|---|---|---|---|---|---|
Illinois | 12,419,293 | +3 | 12,830,632 | +12 | 14,316,487 | +6 | 15,138,849 |
Cook County | 5,376,741 | -3 | 5,194,675 | +10 | 5,707,832 | +5 | 5,990,243 |
DuPage County | 904,161 | +1 | 916,924 | +10 | 1,010,323 | +2 | 1,034,039 |
Total Working Age Population:
Total Households:
Total Working Age Population:
Total Households:
Total Working Age Population:
Total Households: