Industrial Properties
3740 Oakton Street, 3732-3740 Skokie, IL 60076
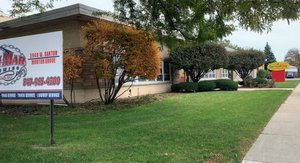
3740 Oakton Street, 3732-3740 Skokie, IL 60076

Details & Description
Property Highlights
- • 106.16 of frontage on Oakton Street
- • Attractive corner location
- • M-2 Zoning Light Industrial
- • Triple catch basins
- • New power to building
- • New roof and drains
Additional Photos


Listing Agents

Denise Chaimovitz
M: 847-804-8566
denise@entrecommercial.com
M: 847-804-8566
denise@entrecommercial.com
While we strive to provide the most accurate information, all listing information, and demographic data, is provided by third-parties. As such, MyEListing will not be responsible for the accuracy of the information. It is strongly recommended that you verify all information with the listing agent, and any relevant agencies, prior to making any decisions.