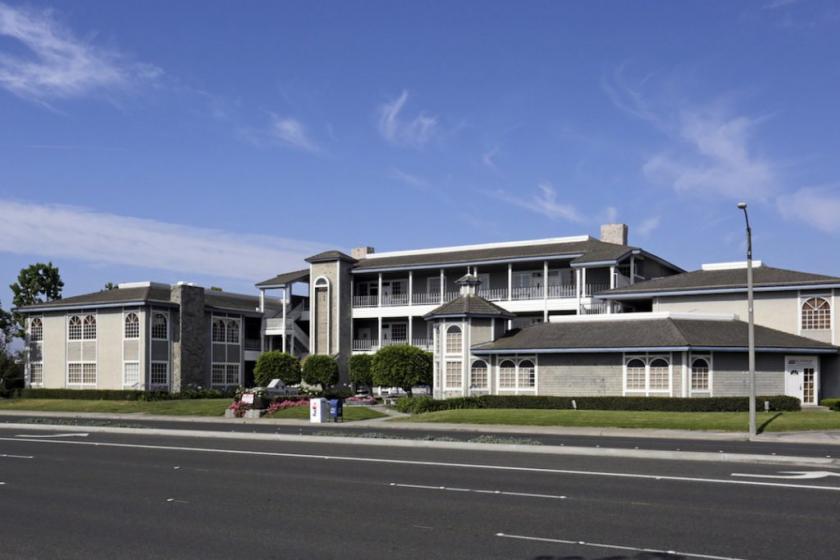
Retail Space
18837 Brookhurst Street Fountain Valley, CA 92708
18837 Brookhurst Street Fountain Valley, CA 92708
Details & Description
Property Highlights
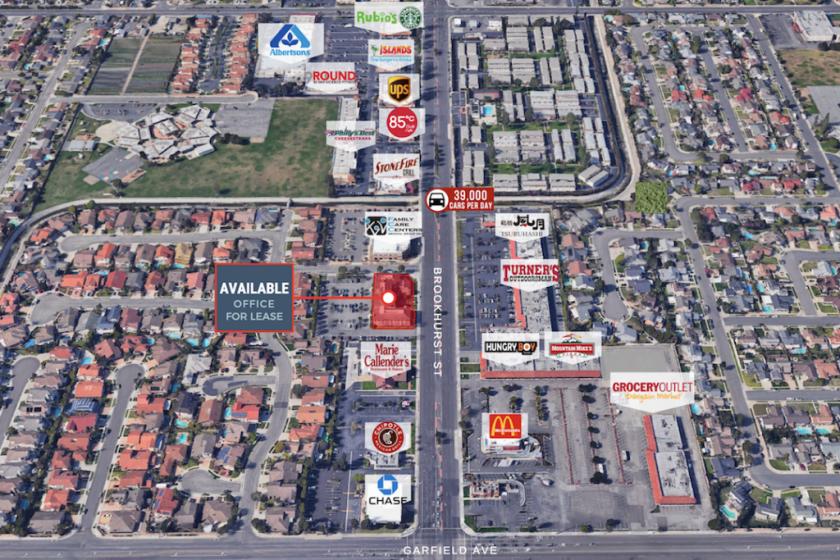
• Convenient access to major retailers and popular restaurants on Brookhurst St. New Grocery Outlet directly across
• Ideal location just blocks from I-405 commuter freeway
Listing Agents

Kate Berry
O: 949-723-7300
kate@commercialwest.com
O: 949-723-7300
kate@commercialwest.com
While we strive to provide the most accurate information, all listing information, and demographic data, is provided by third-parties. As such, MyEListing will not be responsible for the accuracy of the information. It is strongly recommended that you verify all information with the listing agent, and any relevant agencies, prior to making any decisions.