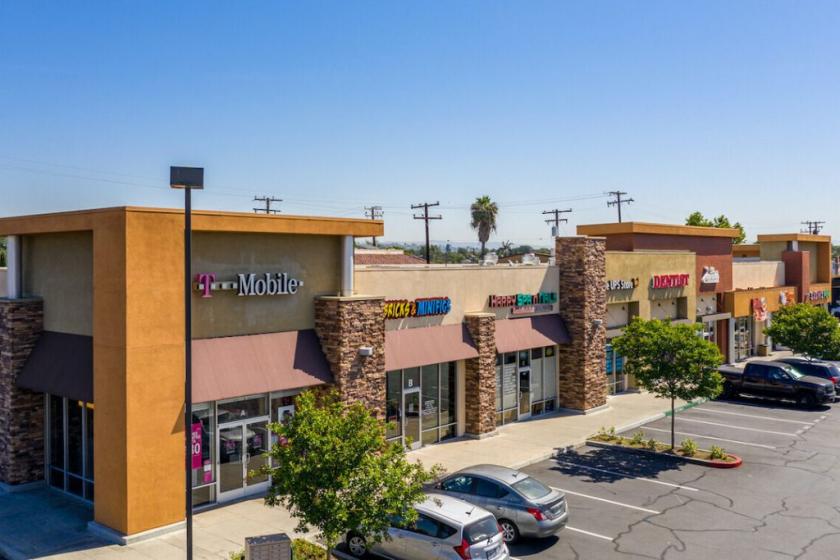
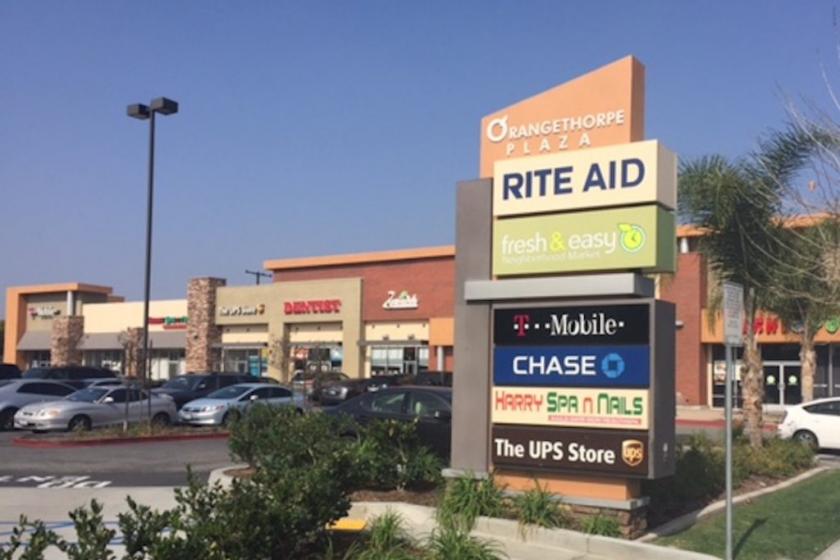
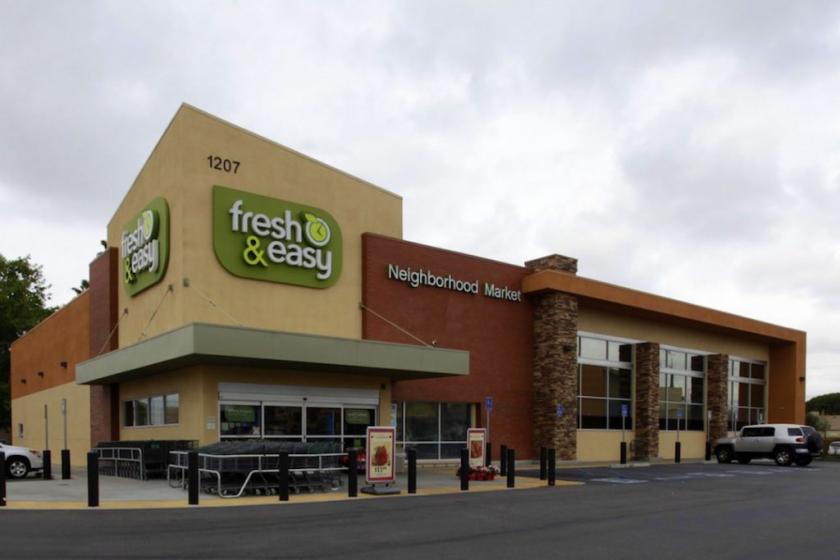
1-Mile | 3-Miles | 5-Miles | ||
---|---|---|---|---|
Total Population | 35,624 | 248,602 | 638,606 | |
Population Median Age | 35 | 36 | 37 | |
Population by Age | 0-9 Yrs | 5003 (14%) | 33872 (13%) | 81791 (12%) |
10-19 Yrs | 4916 (13%) | 33978 (13%) | 85120 (13%) | |
20-29 Yrs | 5885 (16%) | 40215 (16%) | 106199 (16%) | |
30-39 Yrs | 5102 (14%) | 36585 (14%) | 89928 (14%) | |
40-49 Yrs | 4715 (13%) | 32658 (13%) | 84031 (13%) | |
50-59 Yrs | 4283 (12%) | 30668 (12%) | 80340 (12%) | |
60-69 Yrs | 3158 (8%) | 21287 (8%) | 57688 (9%) | |
70+ Yrs | 2561 (7%) | 19340 (7%) | 53509 (8%) | |
Median HH Income | $68,260 | $70,865 | $72,240 | |
Total Household Income | < 24K | 1743 (17%) | 11004 (15%) | 27989 (14%) |
25-49K | 2058 (20%) | 13846 (19%) | 35832 (19%) | |
50-74K | 1814 (17%) | 13599 (18%) | 33353 (17%) | |
75-99K | 1472 (14%) | 10074 (13%) | 26262 (14%) | |
100-199K | 2678 (26%) | 18384 (25%) | 49812 (26%) | |
200K+ | 409 (4%) | 5409 (7%) | 13844 (7%) | |
Highest Education Level | No Diploma | 5357 | 34983 | 86794 |
Diploma or GED | 5692 | 36514 | 96337 | |
Some College | 4582 | 32460 | 88607 | |
Assoc. Degree | 1750 | 11742 | 31205 | |
Bachelors Degree | 3977 | 32152 | 82923 | |
Higher Degree | 1485 | 14093 | 34925 | |
Total Housing Units | 10,551 | 75,679 | 195,530 | |
--Owner-Occupied | 4,910 | 33,073 | 90,579 | |
--Renter-Occupied | 5,265 | 39,242 | 96,514 | |
Owner-Occupied Values | < 100K | 372 | 1347 | 4530 |
100-199K | 209 | 492 | 1762 | |
200-299K | 138 | 963 | 3249 | |
300-399K | 350 | 2609 | 7187 | |
400-499K | 1114 | 6593 | 17008 | |
500K+ | 2727 | 21070 | 56842 | |
Total Working Age Population | 27,472 | 194,139 | 506,039 | |
In Work Force | 18,670 | 130,201 | 336,076 | |
Not In Work Force | 8,802 | 63,938 | 169,964 | |
Workforce Employed | 17,294 | 122,450 | 316,672 | |
Workforce Unemployed | 1,376 | 7,721 | 19,169 | |
Civlian Workforce | 18,670 | 130,171 | 335,841 | |
Military Workforce | 0 | 30 | 235 | |
Total Households | 10,175 | 72,315 | 187,092 | |
Family Households | 7,444 | 53,669 | 139,622 | |
Non-Family Households | 2,731 | 18,646 | 47,471 | |
Married Couple | 5,319 | 37,671 | 98,740 | |
Other Family | 2,125 | 15,998 | 40,881 | |
Married w/Child | 2,363 | 17,686 | 44,940 | |
Single Male w/Child | 259 | 2,042 | 4,561 | |
Single Female w/Child | 635 | 5,110 | 12,946 |
Population Change Last Two Decades - Plus Projection
2000 | % | 2010 | % | 2020 | % | 2030 | |
---|---|---|---|---|---|---|---|
California | 33,871,648 | +10 | 37,253,956 | +9 | 40,467,295 | +8 | 43,631,295 |
Los Angeles County | 9,519,338 | +3 | 9,818,605 | +6 | 10,369,367 | +4 | 10,759,850 |
Orange County | 2,846,289 | +6 | 3,010,232 | +8 | 3,257,087 | +5 | 3,431,096 |
Total Working Age Population:
Total Households:
Total Working Age Population:
Total Households:
Total Working Age Population:
Total Households: