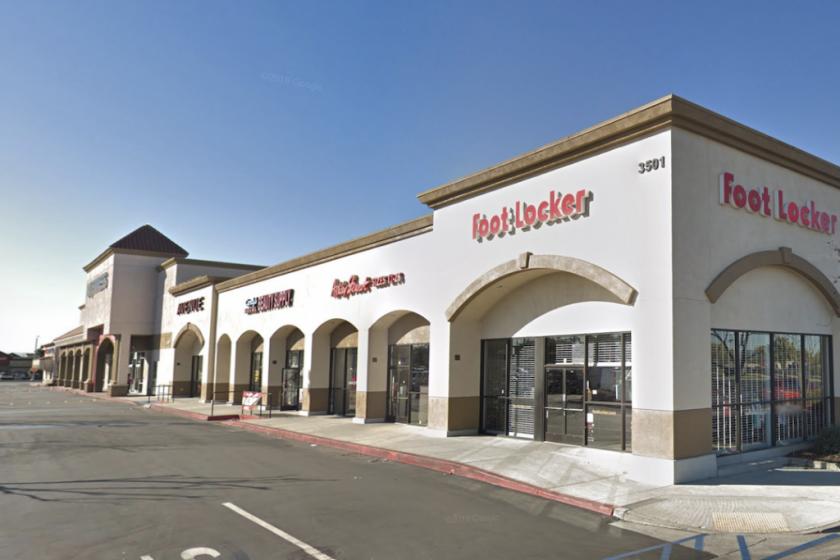
1-Mile | 3-Miles | 5-Miles | ||
---|---|---|---|---|
Total Population | 36,145 | 361,615 | 893,332 | |
Population Median Age | 36 | 36 | 36 | |
Population by Age | 0-9 Yrs | 5005 (13%) | 50697 (14%) | 125836 (14%) |
10-19 Yrs | 4756 (13%) | 47619 (13%) | 121195 (13%) | |
20-29 Yrs | 5593 (15%) | 56161 (15%) | 138624 (15%) | |
30-39 Yrs | 4943 (13%) | 53647 (14%) | 130900 (14%) | |
40-49 Yrs | 4835 (13%) | 47058 (13%) | 116642 (13%) | |
50-59 Yrs | 4572 (12%) | 46136 (12%) | 112926 (12%) | |
60-69 Yrs | 3650 (10%) | 33377 (9%) | 81572 (9%) | |
70+ Yrs | 2791 (7%) | 26920 (7%) | 65638 (7%) | |
Median HH Income | $57,886 | $50,273 | $53,108 | |
Total Household Income | < 24K | 2373 (21%) | 30461 (25%) | 70078 (24%) |
25-49K | 2570 (22%) | 28369 (24%) | 64353 (22%) | |
50-74K | 2082 (18%) | 21398 (18%) | 47553 (16%) | |
75-99K | 1458 (13%) | 13971 (11%) | 31415 (11%) | |
100-199K | 2261 (20%) | 20154 (17%) | 52821 (18%) | |
200K+ | 456 (4%) | 3822 (3%) | 15543 (5%) | |
Highest Education Level | No Diploma | 6559 | 61918 | 161137 |
Diploma or GED | 6004 | 59251 | 137154 | |
Some College | 5334 | 57481 | 124217 | |
Assoc. Degree | 1734 | 17525 | 39394 | |
Bachelors Degree | 2785 | 28690 | 80501 | |
Higher Degree | 1482 | 12157 | 39272 | |
Total Housing Units | 11,729 | 124,773 | 297,461 | |
--Owner-Occupied | 4,466 | 42,676 | 113,566 | |
--Renter-Occupied | 6,733 | 75,499 | 168,195 | |
Owner-Occupied Values | < 100K | 60 | 892 | 2505 |
100-199K | 43 | 822 | 2584 | |
200-299K | 381 | 3743 | 9688 | |
300-399K | 786 | 9012 | 21649 | |
400-499K | 1025 | 11330 | 23399 | |
500K+ | 2171 | 16876 | 53741 | |
Total Working Age Population | 28,214 | 281,125 | 693,422 | |
In Work Force | 18,625 | 183,673 | 446,549 | |
Not In Work Force | 9,590 | 97,452 | 246,873 | |
Workforce Employed | 17,530 | 170,531 | 415,396 | |
Workforce Unemployed | 1,094 | 13,006 | 30,933 | |
Civlian Workforce | 18,625 | 183,537 | 446,330 | |
Military Workforce | 0 | 136 | 219 | |
Total Households | 11,199 | 118,175 | 281,761 | |
Family Households | 7,825 | 78,631 | 191,329 | |
Non-Family Households | 3,374 | 39,544 | 90,432 | |
Married Couple | 4,202 | 40,852 | 106,262 | |
Other Family | 3,622 | 37,779 | 85,068 | |
Married w/Child | 1,920 | 19,403 | 49,839 | |
Single Male w/Child | 389 | 4,299 | 9,978 | |
Single Female w/Child | 1,054 | 12,525 | 27,534 |
Population Change Last Two Decades - Plus Projection
2000 | % | 2010 | % | 2020 | % | 2030 | |
---|---|---|---|---|---|---|---|
California | 33,871,648 | +10 | 37,253,956 | +9 | 40,467,295 | +8 | 43,631,295 |
Los Angeles County | 9,519,338 | +3 | 9,818,605 | +6 | 10,369,367 | +4 | 10,759,850 |
Total Working Age Population:
Total Households:
Total Working Age Population:
Total Households:
Total Working Age Population:
Total Households: