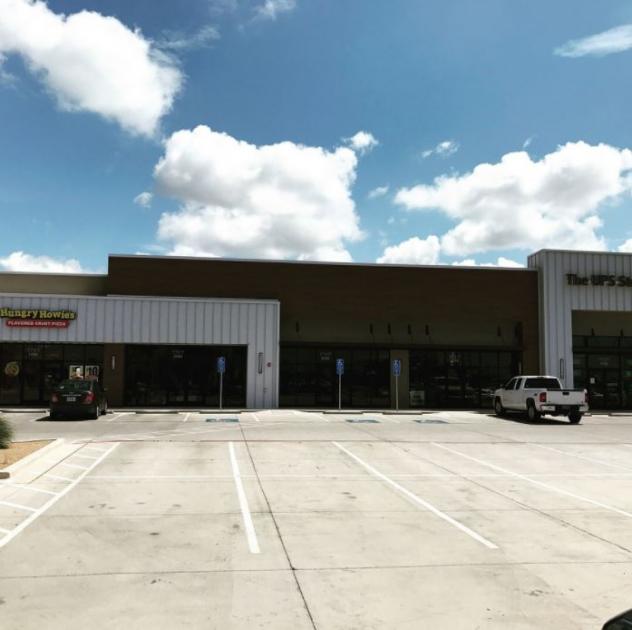
Retail Space
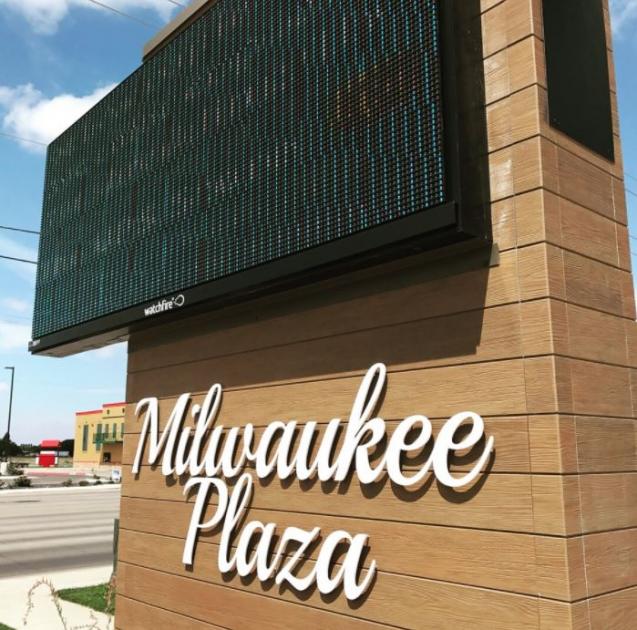
7717 Milwaukee Avenue Lubbock, TX 79424
7717 Milwaukee Avenue Lubbock, TX 79424
Details & Description
Property Highlights
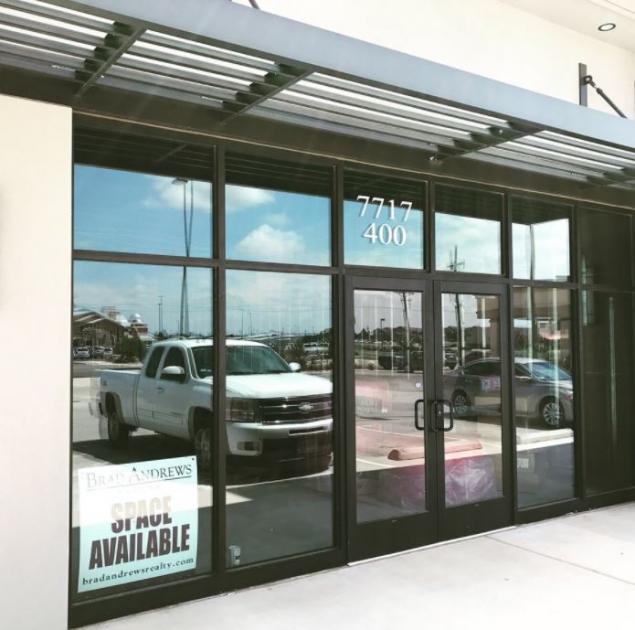
- • First generation space
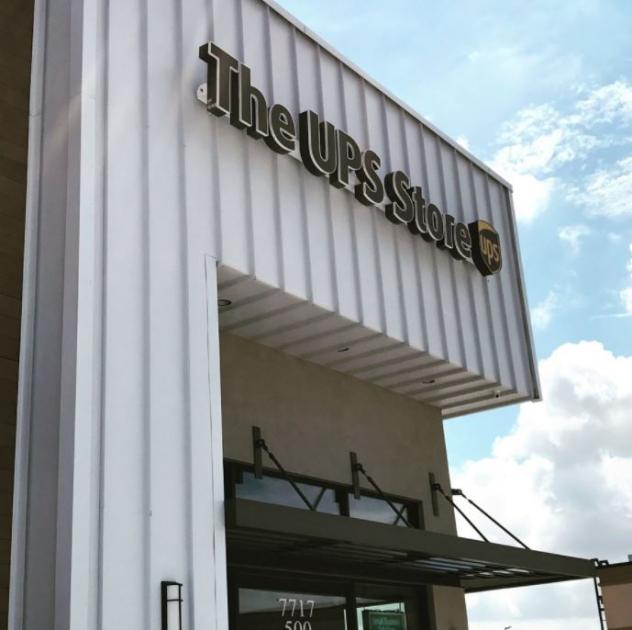
- • National co-tenants in UPS Store and Hungry Howies
- • High traffic corridor
- • High-growth part of town
Additional Photos
Listing Agents

Brice Kelly
O: 806-368-6554
M: 512-560-3241
brice@bradandrewsrealty.com
O: 806-368-6554
M: 512-560-3241
brice@bradandrewsrealty.com
While we strive to provide the most accurate information, all listing information, and demographic data, is provided by third-parties. As such, MyEListing will not be responsible for the accuracy of the information. It is strongly recommended that you verify all information with the listing agent, and any relevant agencies, prior to making any decisions.


