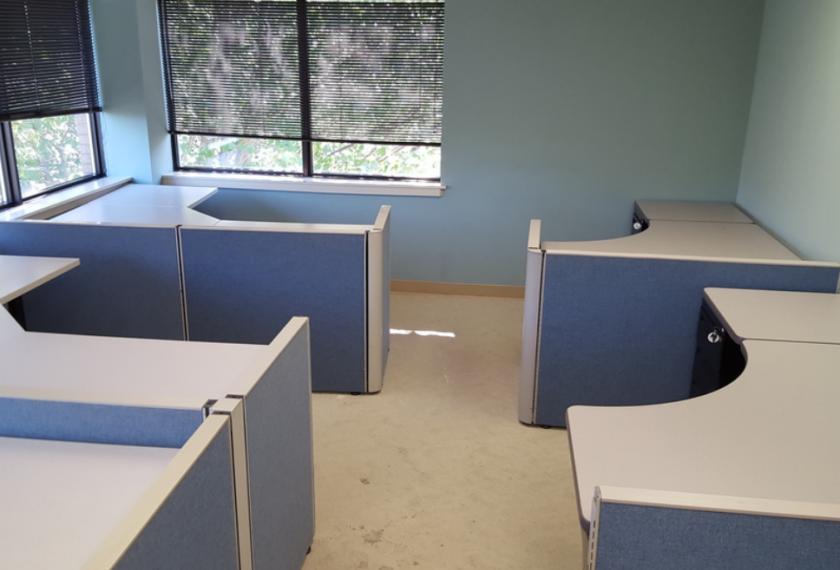
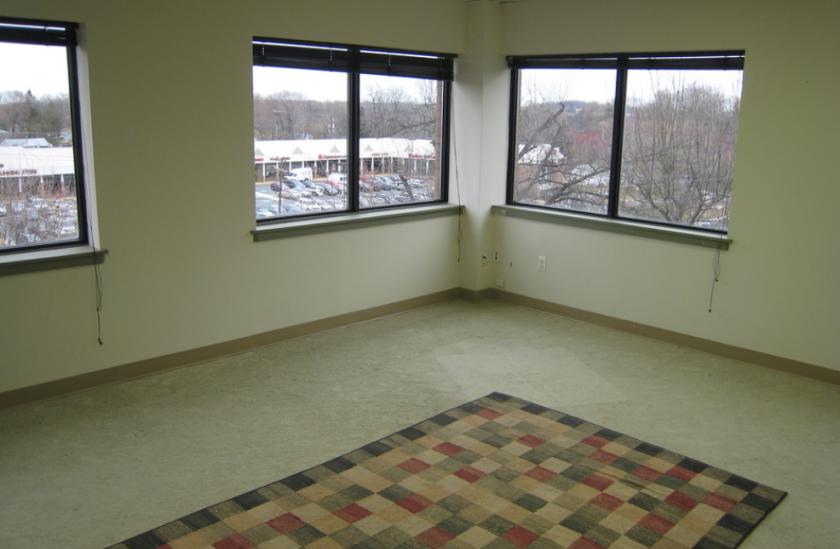
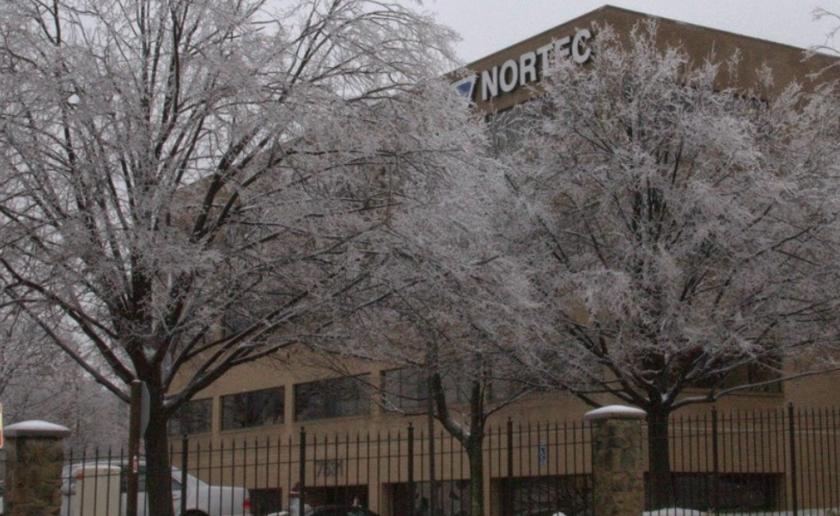
1-Mile | 3-Miles | 5-Miles | ||
---|---|---|---|---|
Total Population | 21,839 | 142,501 | 316,531 | |
Population Median Age | 35 | 38 | 38 | |
Population by Age | 0-9 Yrs | 3376 (15%) | 18666 (13%) | 41134 (12%) |
10-19 Yrs | 1872 (8%) | 15858 (11%) | 38724 (12%) | |
20-29 Yrs | 3319 (15%) | 19270 (13%) | 37792 (11%) | |
30-39 Yrs | 5071 (23%) | 23112 (16%) | 46117 (14%) | |
40-49 Yrs | 3055 (13%) | 20976 (14%) | 46352 (14%) | |
50-59 Yrs | 2393 (10%) | 17964 (12%) | 42639 (13%) | |
60-69 Yrs | 1662 (7%) | 14261 (10%) | 34198 (10%) | |
70+ Yrs | 1091 (4%) | 12394 (8%) | 29575 (9%) | |
Median HH Income | $117,655 | $130,208 | $138,911 | |
Total Household Income | < 24K | 555 (6%) | 3921 (7%) | 8509 (7%) |
25-49K | 781 (9%) | 4597 (8%) | 9952 (8%) | |
50-74K | 943 (11%) | 5702 (10%) | 10815 (9%) | |
75-99K | 1212 (14%) | 6519 (12%) | 11988 (10%) | |
100-199K | 2737 (33%) | 17795 (32%) | 36380 (31%) | |
200K+ | 1916 (23%) | 15677 (28%) | 37532 (32%) | |
Highest Education Level | No Diploma | 777 | 5963 | 15300 |
Diploma or GED | 1512 | 9209 | 21242 | |
Some College | 1453 | 9607 | 20807 | |
Assoc. Degree | 777 | 4557 | 8863 | |
Bachelors Degree | 4988 | 31876 | 68910 | |
Higher Degree | 5878 | 38545 | 84402 | |
Total Housing Units | 8,678 | 57,598 | 121,351 | |
--Owner-Occupied | 3,733 | 31,636 | 76,131 | |
--Renter-Occupied | 4,410 | 22,576 | 39,045 | |
Owner-Occupied Values | < 100K | 8 | 211 | 554 |
100-199K | 135 | 745 | 1927 | |
200-299K | 440 | 1796 | 3023 | |
300-399K | 207 | 2031 | 3575 | |
400-499K | 377 | 3075 | 6895 | |
500K+ | 2565 | 23778 | 60156 | |
Total Working Age Population | 17,305 | 113,641 | 250,888 | |
In Work Force | 13,083 | 83,318 | 178,867 | |
Not In Work Force | 4,222 | 30,323 | 72,021 | |
Workforce Employed | 12,587 | 80,055 | 171,887 | |
Workforce Unemployed | 454 | 2,688 | 5,576 | |
Civlian Workforce | 13,041 | 82,743 | 177,463 | |
Military Workforce | 42 | 574 | 1,403 | |
Total Households | 8,144 | 54,211 | 115,176 | |
Family Households | 5,257 | 35,128 | 79,136 | |
Non-Family Households | 2,887 | 19,083 | 36,040 | |
Married Couple | 4,263 | 28,615 | 65,663 | |
Other Family | 994 | 6,513 | 13,473 | |
Married w/Child | 2,325 | 14,178 | 31,861 | |
Single Male w/Child | 273 | 948 | 1,901 | |
Single Female w/Child | 227 | 2,142 | 4,518 |
Population Change Last Two Decades - Plus Projection
2000 | % | 2010 | % | 2020 | % | 2030 | |
---|---|---|---|---|---|---|---|
District of Columbia | 572,059 | +5 | 601,723 | +21 | 729,501 | +15 | 842,154 |
Maryland | 5,296,486 | +9 | 5,773,552 | +6 | 6,141,900 | +6 | 6,518,750 |
Montgomery County | 873,341 | +11 | 971,777 | +8 | 1,052,050 | +7 | 1,128,800 |
Virginia | 7,078,515 | +13 | 8,001,024 | +8 | 8,655,021 | +8 | 9,331,666 |
Arlington County | 189,453 | +10 | 207,627 | +20 | 249,298 | +10 | 274,339 |
Fairfax County | 969,749 | +12 | 1,081,726 | +7 | 1,162,504 | +7 | 1,244,025 |
Prince William County | 280,813 | +43 | 402,002 | +19 | 478,134 | +20 | 571,844 |
Fairfax city | 21,498 | +5 | 22,565 | +11 | 25,047 | +5 | 26,397 |
Falls Church city | 10,377 | +19 | 12,332 | +22 | 14,988 | +14 | 17,032 |
Total Working Age Population:
Total Households:
Total Working Age Population:
Total Households:
Total Working Age Population:
Total Households: