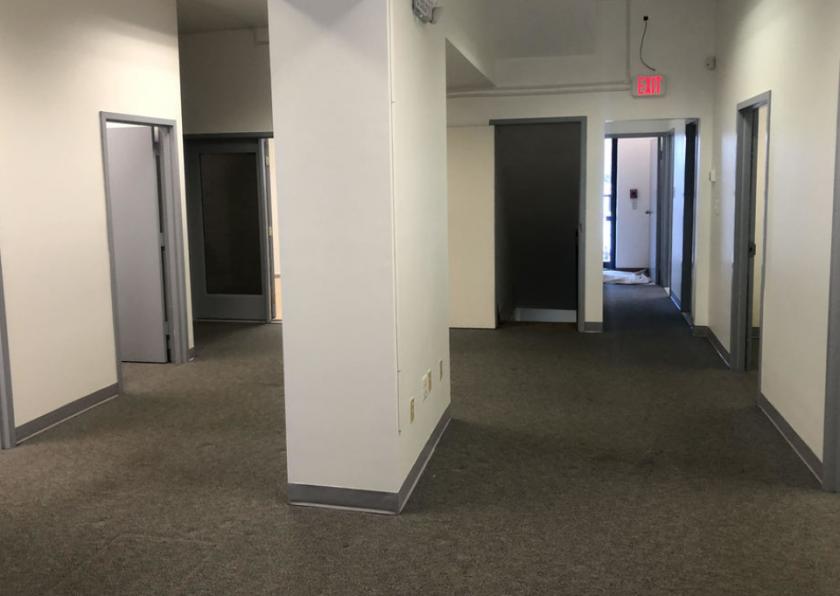
Retail Space
4304 Georgia Avenue Northwest Washington, DC 20011
4304 Georgia Avenue Northwest Washington, DC 20011

Details & Description
Property Highlights
- • 3D Virtual Tours Available
- • Fully built out Basement space included
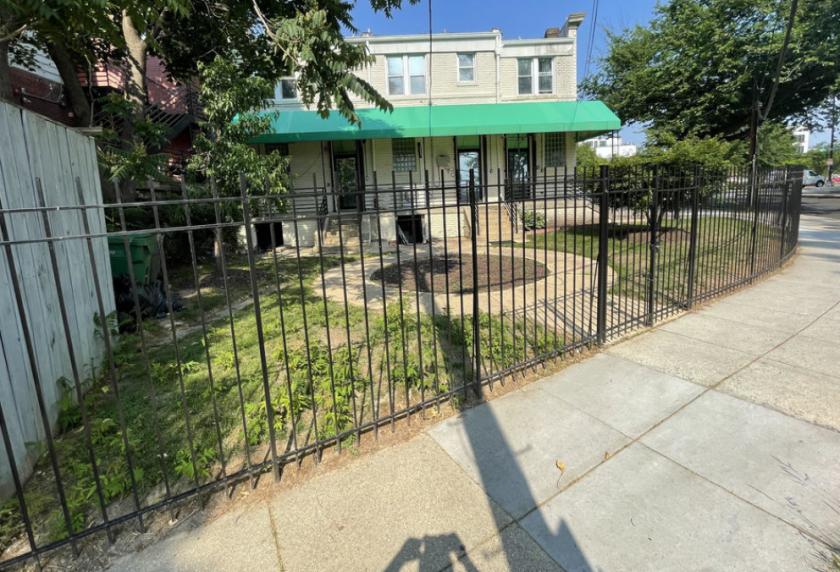
- • Fenced in Lot with potential for outdoor seating
- • Signage availability
Listing Agents

Shadi Ayyoubi
O: 703-506-2850
shadi.ayyoubi@longandfoster.com
O: 703-506-2850
shadi.ayyoubi@longandfoster.com
While we strive to provide the most accurate information, all listing information, and demographic data, is provided by third-parties. As such, MyEListing will not be responsible for the accuracy of the information. It is strongly recommended that you verify all information with the listing agent, and any relevant agencies, prior to making any decisions.