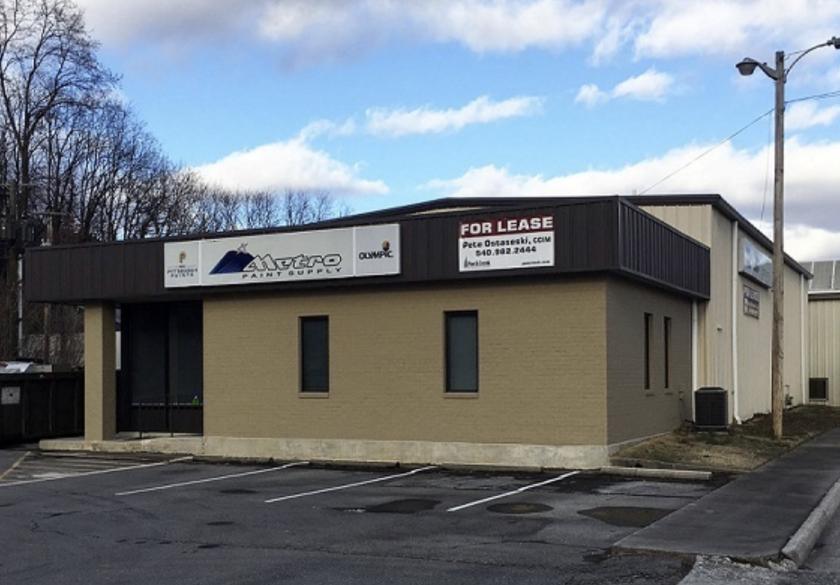
1-Mile | 3-Miles | 5-Miles | ||
---|---|---|---|---|
Total Population | 9,247 | 53,476 | 113,420 | |
Population Median Age | 42 | 42 | 41 | |
Population by Age | 0-9 Yrs | 1009 (10%) | 6030 (11%) | 13421 (11%) |
10-19 Yrs | 829 (8%) | 5492 (10%) | 12556 (11%) | |
20-29 Yrs | 1468 (15%) | 6262 (11%) | 14709 (12%) | |
30-39 Yrs | 1106 (11%) | 6591 (12%) | 14372 (12%) | |
40-49 Yrs | 1096 (11%) | 7137 (13%) | 14360 (12%) | |
50-59 Yrs | 1077 (11%) | 6829 (12%) | 15171 (13%) | |
60-69 Yrs | 1126 (12%) | 7080 (13%) | 14043 (12%) | |
70+ Yrs | 1536 (16%) | 8054 (15%) | 14788 (13%) | |
Median HH Income | $59,396 | $63,158 | $53,177 | |
Total Household Income | < 24K | 869 (20%) | 3957 (16%) | 11342 (23%) |
25-49K | 863 (20%) | 5061 (21%) | 11534 (23%) | |
50-74K | 1018 (24%) | 4954 (20%) | 9193 (18%) | |
75-99K | 505 (11%) | 2892 (12%) | 5468 (11%) | |
100-199K | 834 (19%) | 5028 (21%) | 8031 (16%) | |
200K+ | 125 (2%) | 1702 (7%) | 2881 (5%) | |
Highest Education Level | No Diploma | 542 | 2481 | 8833 |
Diploma or GED | 1447 | 7479 | 21647 | |
Some College | 1253 | 7289 | 14874 | |
Assoc. Degree | 859 | 4326 | 7906 | |
Bachelors Degree | 1604 | 10525 | 16444 | |
Higher Degree | 1018 | 7234 | 11202 | |
Total Housing Units | 4,635 | 25,904 | 54,121 | |
--Owner-Occupied | 2,246 | 14,463 | 27,335 | |
--Renter-Occupied | 1,970 | 9,132 | 21,114 | |
Owner-Occupied Values | < 100K | 39 | 724 | 4379 |
100-199K | 1351 | 5683 | 10908 | |
200-299K | 674 | 4565 | 6267 | |
300-399K | 146 | 1901 | 2958 | |
400-499K | 27 | 729 | 1210 | |
500K+ | 9 | 862 | 1614 | |
Total Working Age Population | 7,825 | 44,172 | 92,427 | |
In Work Force | 5,171 | 28,579 | 58,230 | |
Not In Work Force | 2,655 | 15,593 | 34,197 | |
Workforce Employed | 4,978 | 27,628 | 55,483 | |
Workforce Unemployed | 192 | 927 | 2,682 | |
Civlian Workforce | 5,171 | 28,555 | 58,165 | |
Military Workforce | 0 | 24 | 65 | |
Total Households | 4,216 | 23,595 | 48,448 | |
Family Households | 2,428 | 13,962 | 27,564 | |
Non-Family Households | 1,787 | 9,633 | 20,884 | |
Married Couple | 1,823 | 10,740 | 18,780 | |
Other Family | 606 | 3,222 | 8,784 | |
Married w/Child | 653 | 3,615 | 6,096 | |
Single Male w/Child | 166 | 638 | 1,223 | |
Single Female w/Child | 291 | 1,369 | 3,684 |
Population Change Last Two Decades - Plus Projection
2000 | % | 2010 | % | 2020 | % | 2030 | |
---|---|---|---|---|---|---|---|
Virginia | 7,078,515 | +13 | 8,001,024 | +8 | 8,655,021 | +8 | 9,331,666 |
Franklin County | 47,286 | +19 | 56,159 | 0 | 56,237 | +7 | 60,354 |
Roanoke County | 85,778 | +8 | 92,376 | +2 | 94,145 | +3 | 97,249 |
Roanoke city | 94,911 | +2 | 97,032 | +4 | 100,891 | +1 | 102,388 |
Salem city | 24,747 | 0 | 24,802 | +5 | 25,953 | +1 | 26,141 |
Total Working Age Population:
Total Households:
Total Working Age Population:
Total Households:
Total Working Age Population:
Total Households: