Retail Space
303 East Katella Avenue Orange, CA 92867
303 East Katella Avenue Orange, CA 92867
Details & Description
Property Highlights
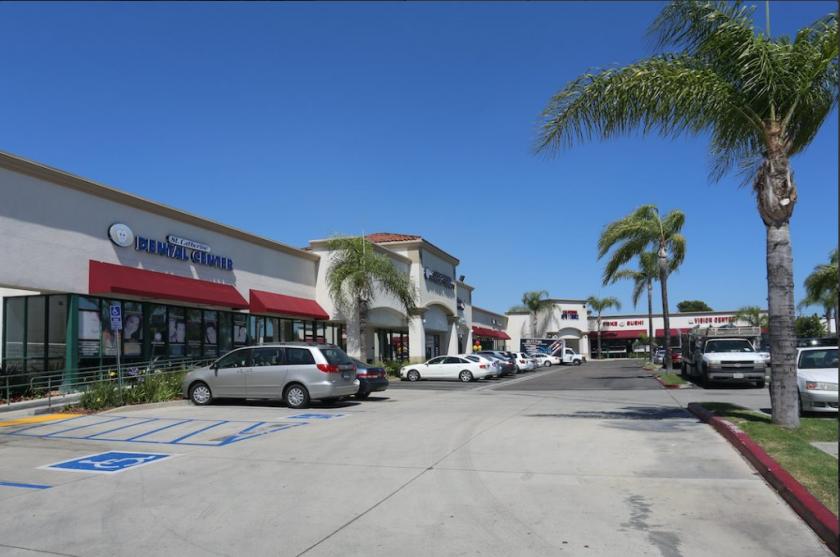
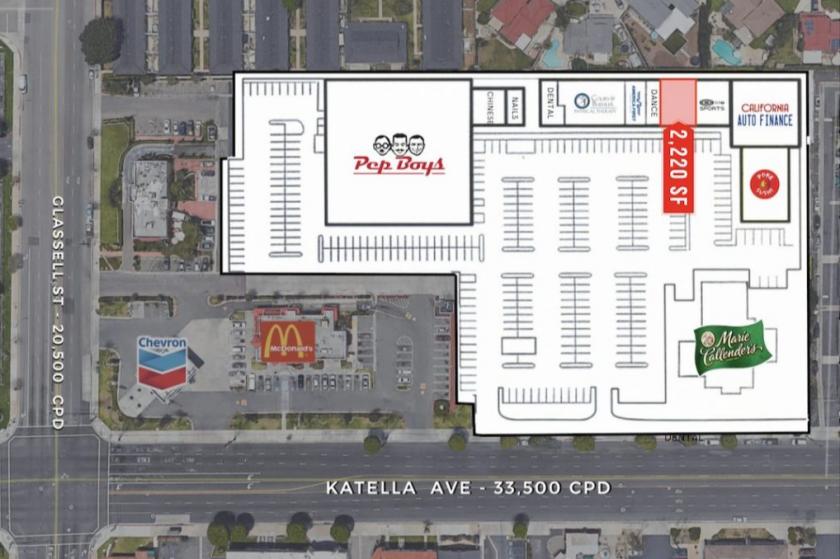
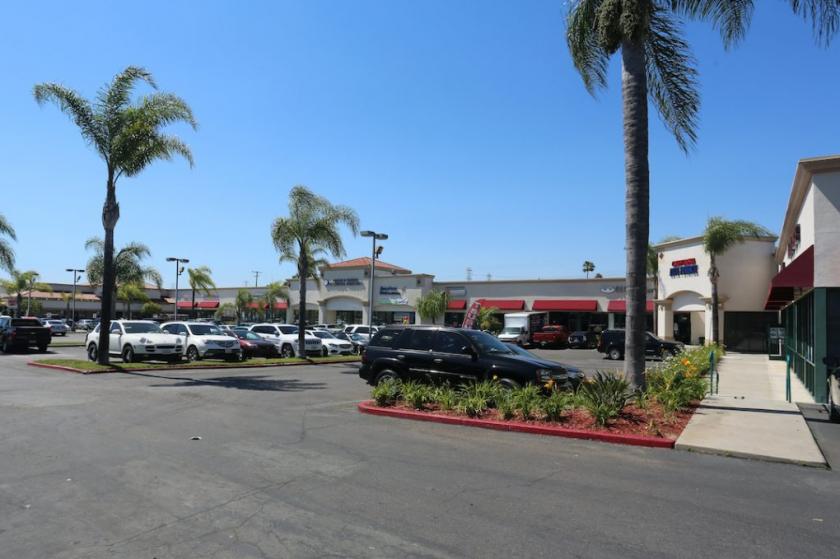
• The center is located directly on Katella Avenue, the main commuter thoroughfare between CA-57 and CA-55
• Strong daytime traffic densely populated industrial business area nearby
Listing Agents

Doug Wombacher
O: 949-723-7300
doug@commercialwest.com
O: 949-723-7300
doug@commercialwest.com
While we strive to provide the most accurate information, all listing information, and demographic data, is provided by third-parties. As such, MyEListing will not be responsible for the accuracy of the information. It is strongly recommended that you verify all information with the listing agent, and any relevant agencies, prior to making any decisions.