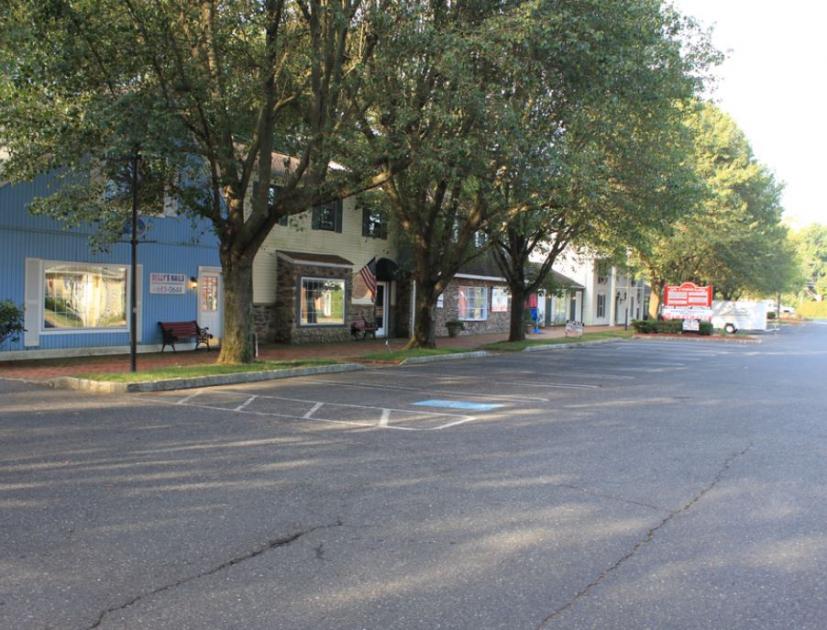
Retail Space
317 New Jersey 34 Marlboro, NJ 07746
317 New Jersey 34 Marlboro, NJ 07746
Details & Description
Property Highlights
- • Traffic count of - 15,000 VPD
- • In area of excellent demographics
- • 5-mile household incomes over $170,000year
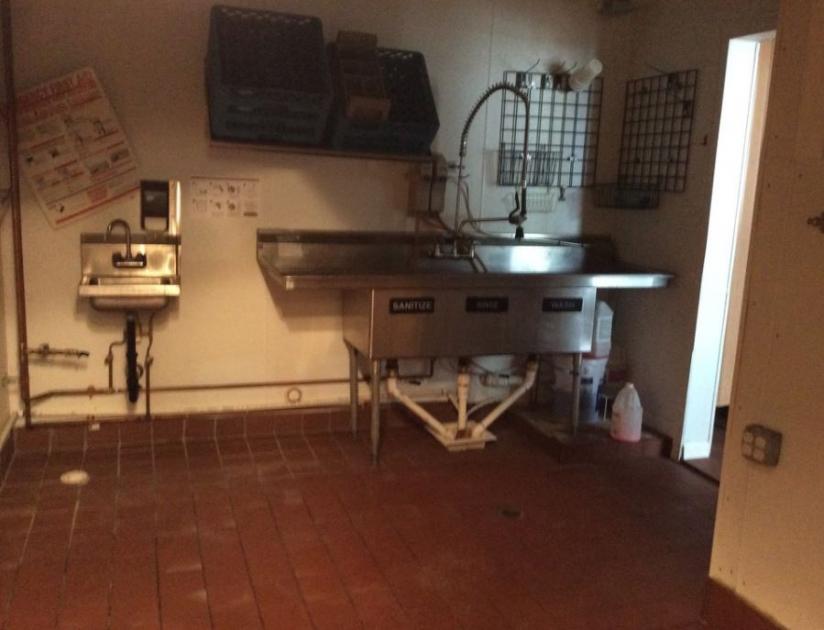
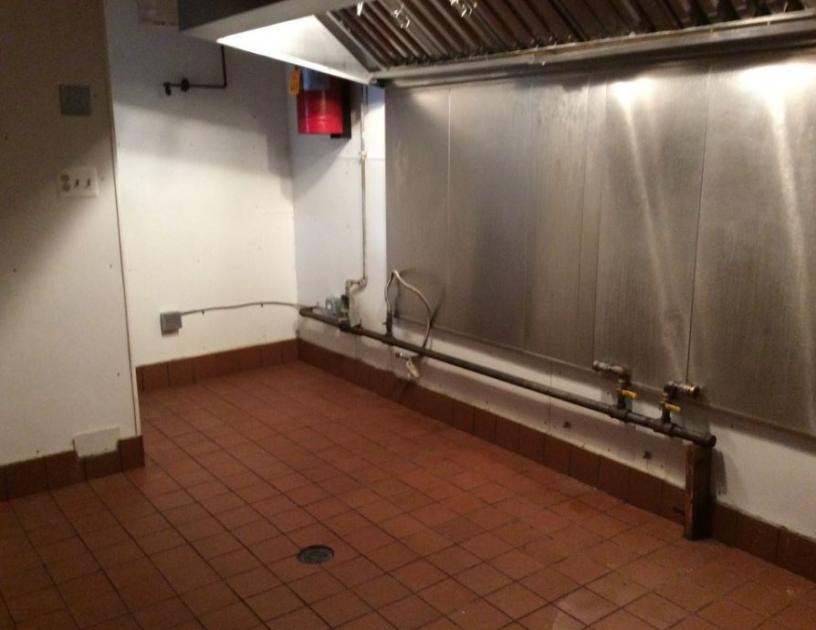
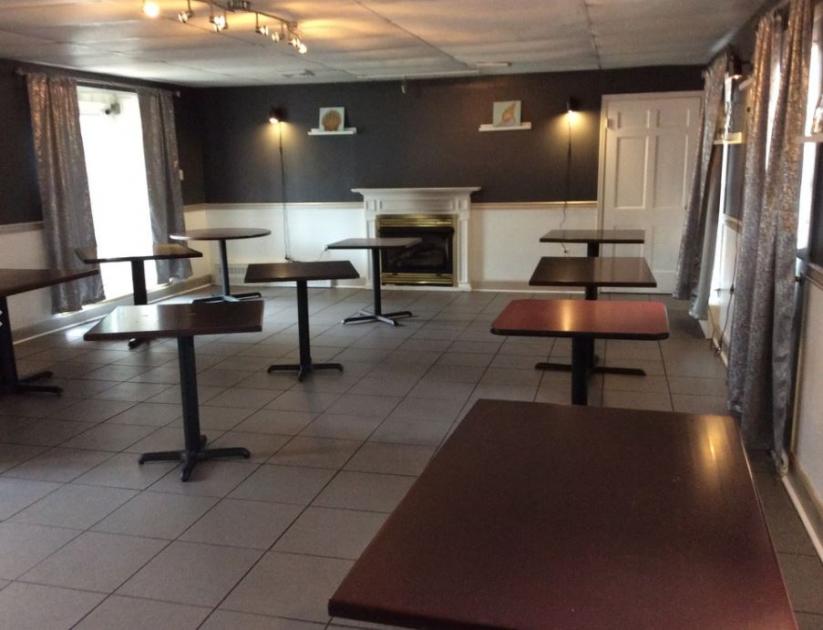
Additional Photos
Listing Agents

Joseph Allegro
O: 732-623-2145
M: 201-988-5534
allegro@sitarcompany.com
O: 732-623-2145
M: 201-988-5534
allegro@sitarcompany.com
While we strive to provide the most accurate information, all listing information, and demographic data, is provided by third-parties. As such, MyEListing will not be responsible for the accuracy of the information. It is strongly recommended that you verify all information with the listing agent, and any relevant agencies, prior to making any decisions.


