Office Space
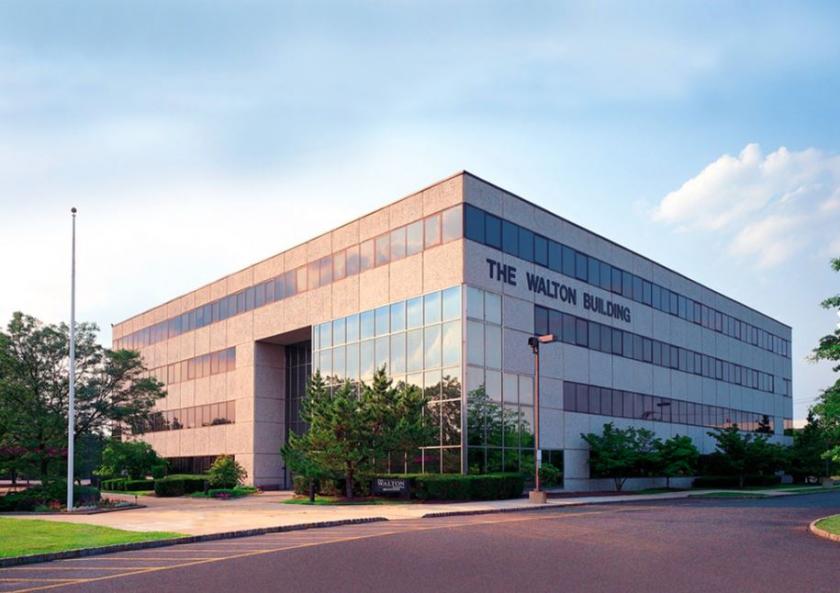
242 Old New Brunswick Road Piscataway, NJ 08854
242 Old New Brunswick Road Piscataway, NJ 08854
Details & Description
Property Highlights
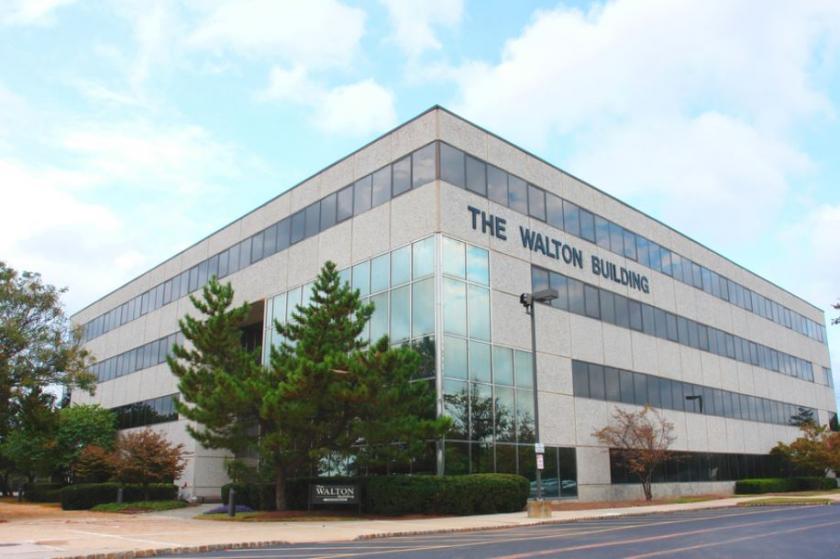
- • Office space for lease with Route 287 exposure
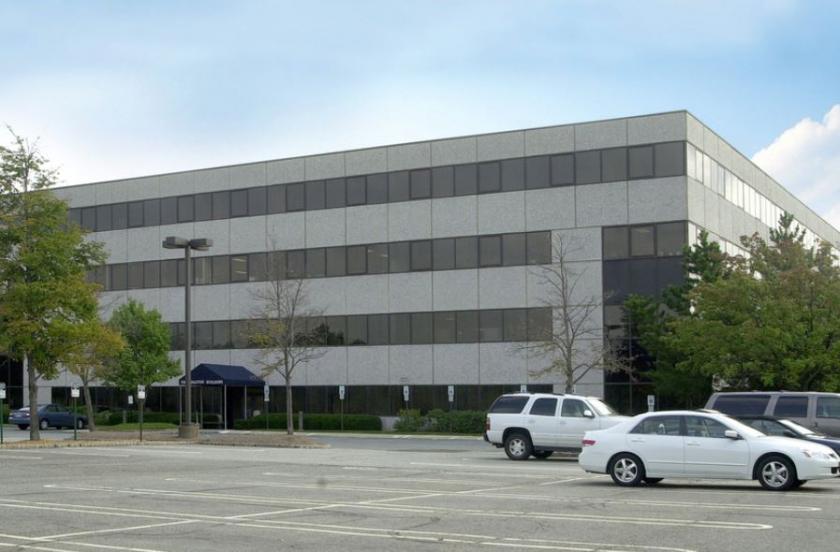
- • Abundant parking, 61000 parking ratio
- • Tenants responsible for their own electric
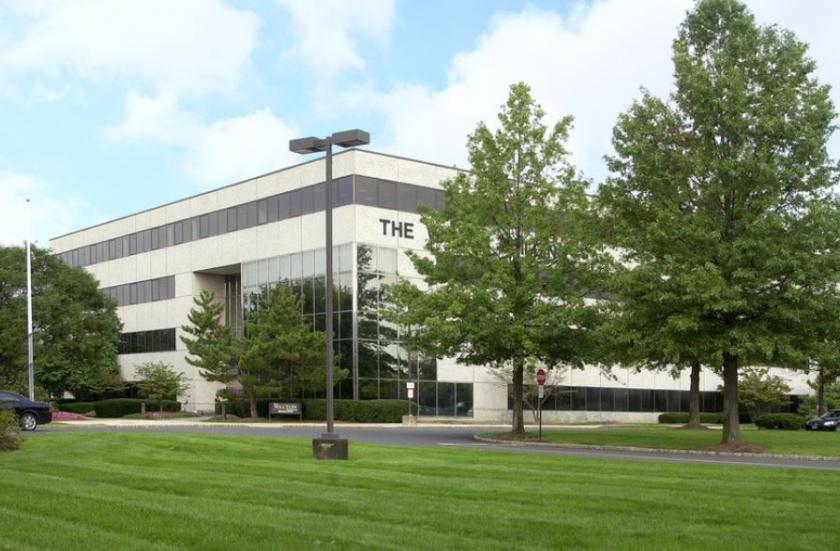
Additional Photos
Listing Agents

Robert Bogash
O: 732-283-9000
M: 732-319-4680
bogash@sitarcompany.com
O: 732-283-9000
M: 732-319-4680
bogash@sitarcompany.com
While we strive to provide the most accurate information, all listing information, and demographic data, is provided by third-parties. As such, MyEListing will not be responsible for the accuracy of the information. It is strongly recommended that you verify all information with the listing agent, and any relevant agencies, prior to making any decisions.


