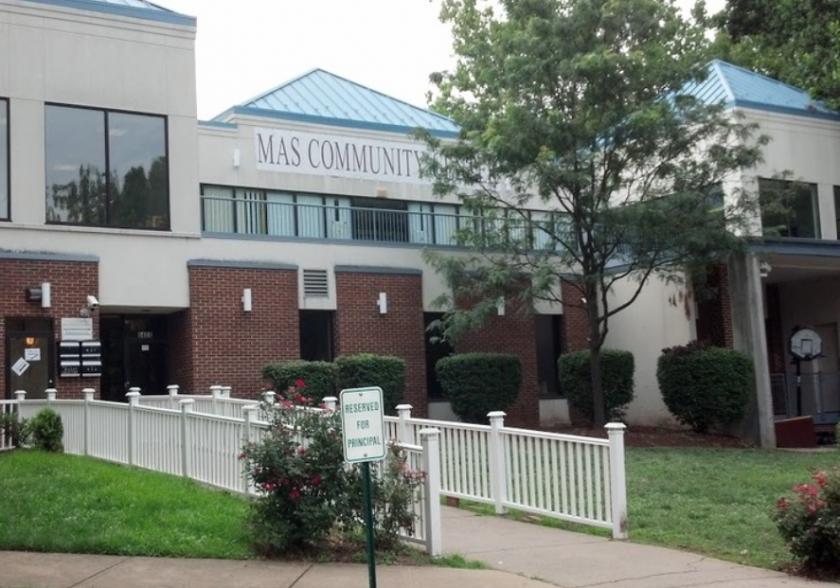
Office Space
6408 Edsall Road Alexandria, VA 22312
6408 Edsall Road Alexandria, VA 22312
Details & Description
Property Highlights
- • Zoned C-8
- • Ceiling Height approx. 10
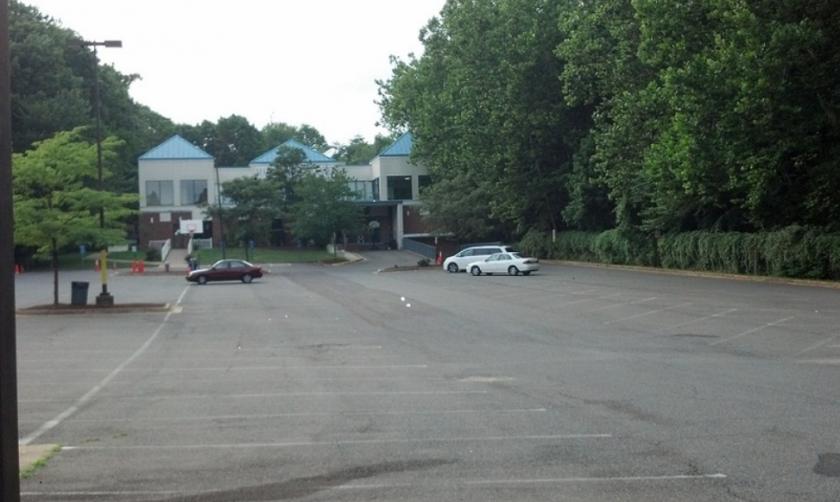
- • Ample parking 130 spaces, approx. 3.21000 SF RBA
Listing Agents

Kathy Killion
O: 703-600-9295
kkillion@lnf.com
O: 703-600-9295
kkillion@lnf.com
While we strive to provide the most accurate information, all listing information, and demographic data, is provided by third-parties. As such, MyEListing will not be responsible for the accuracy of the information. It is strongly recommended that you verify all information with the listing agent, and any relevant agencies, prior to making any decisions.