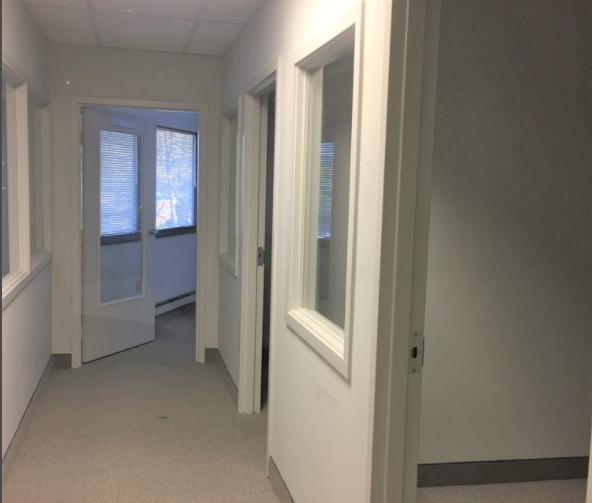
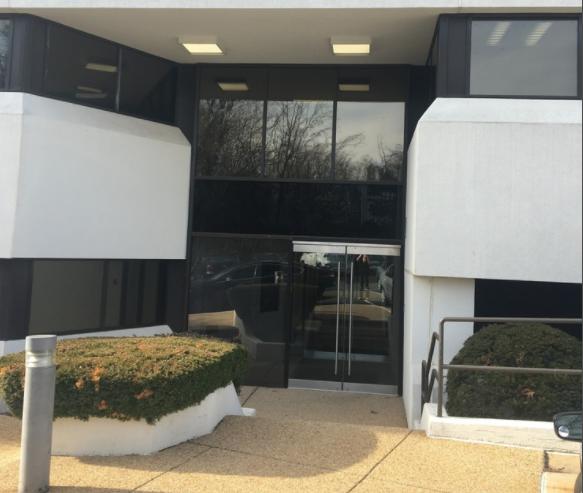
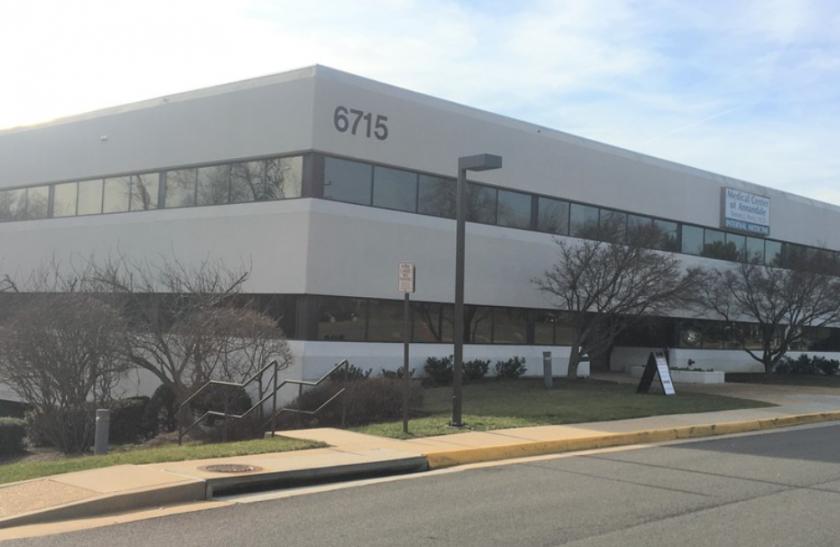
1-Mile | 3-Miles | 5-Miles | ||
---|---|---|---|---|
Total Population | 11,708 | 168,709 | 482,620 | |
Population Median Age | 41 | 37 | 38 | |
Population by Age | 0-9 Yrs | 1510 (12%) | 22356 (13%) | 61406 (12%) |
10-19 Yrs | 983 (8%) | 18275 (10%) | 51972 (10%) | |
20-29 Yrs | 1390 (11%) | 24263 (14%) | 64907 (13%) | |
30-39 Yrs | 2010 (17%) | 29058 (17%) | 85288 (17%) | |
40-49 Yrs | 1224 (10%) | 23145 (13%) | 68181 (14%) | |
50-59 Yrs | 1554 (13%) | 21148 (12%) | 61513 (12%) | |
60-69 Yrs | 1591 (13%) | 17017 (10%) | 48528 (10%) | |
70+ Yrs | 1445 (12%) | 13447 (7%) | 40825 (8%) | |
Median HH Income | $118,698 | $89,337 | $103,923 | |
Total Household Income | < 24K | 439 (10%) | 6429 (11%) | 17246 (9%) |
25-49K | 420 (10%) | 8941 (15%) | 23116 (12%) | |
50-74K | 428 (10%) | 9168 (15%) | 24451 (13%) | |
75-99K | 470 (11%) | 7867 (13%) | 22581 (12%) | |
100-199K | 1500 (36%) | 17932 (30%) | 60903 (33%) | |
200K+ | 891 (21%) | 7763 (13%) | 32633 (18%) | |
Highest Education Level | No Diploma | 1094 | 17282 | 37039 |
Diploma or GED | 1316 | 21431 | 49705 | |
Some College | 1205 | 17935 | 45972 | |
Assoc. Degree | 399 | 7083 | 19833 | |
Bachelors Degree | 2464 | 29589 | 98712 | |
Higher Degree | 2233 | 23497 | 91138 | |
Total Housing Units | 4,344 | 61,516 | 191,169 | |
--Owner-Occupied | 3,200 | 31,549 | 101,460 | |
--Renter-Occupied | 948 | 26,551 | 79,470 | |
Owner-Occupied Values | < 100K | 29 | 479 | 1217 |
100-199K | 65 | 2279 | 5582 | |
200-299K | 217 | 3133 | 9291 | |
300-399K | 360 | 4100 | 13264 | |
400-499K | 925 | 7849 | 21022 | |
500K+ | 1604 | 13709 | 51083 | |
Total Working Age Population | 9,633 | 135,218 | 389,231 | |
In Work Force | 6,509 | 98,671 | 287,397 | |
Not In Work Force | 3,124 | 36,547 | 101,835 | |
Workforce Employed | 6,057 | 93,000 | 272,073 | |
Workforce Unemployed | 368 | 4,347 | 10,517 | |
Civlian Workforce | 6,425 | 97,347 | 282,590 | |
Military Workforce | 84 | 1,323 | 4,806 | |
Total Households | 4,148 | 58,099 | 180,930 | |
Family Households | 2,660 | 37,269 | 111,154 | |
Non-Family Households | 1,488 | 20,830 | 69,776 | |
Married Couple | 1,978 | 26,299 | 84,025 | |
Other Family | 682 | 10,970 | 27,129 | |
Married w/Child | 819 | 12,064 | 39,526 | |
Single Male w/Child | 57 | 1,143 | 2,851 | |
Single Female w/Child | 265 | 3,854 | 9,891 |
Population Change Last Two Decades - Plus Projection
2000 | % | 2010 | % | 2020 | % | 2030 | |
---|---|---|---|---|---|---|---|
District of Columbia | 572,059 | +5 | 601,723 | +21 | 729,501 | +15 | 842,154 |
Maryland | 5,296,486 | +9 | 5,773,552 | +6 | 6,141,900 | +6 | 6,518,750 |
Prince Georges County | 801,515 | +8 | 863,420 | +6 | 916,150 | +4 | 952,950 |
Virginia | 7,078,515 | +13 | 8,001,024 | +8 | 8,655,021 | +8 | 9,331,666 |
Arlington County | 189,453 | +10 | 207,627 | +20 | 249,298 | +10 | 274,339 |
Fairfax County | 969,749 | +12 | 1,081,726 | +7 | 1,162,504 | +7 | 1,244,025 |
Prince William County | 280,813 | +43 | 402,002 | +19 | 478,134 | +20 | 571,844 |
Alexandria city | 128,283 | +9 | 139,966 | +19 | 166,261 | +10 | 182,067 |
Falls Church city | 10,377 | +19 | 12,332 | +22 | 14,988 | +14 | 17,032 |
Total Working Age Population:
Total Households:
Total Working Age Population:
Total Households:
Total Working Age Population:
Total Households: