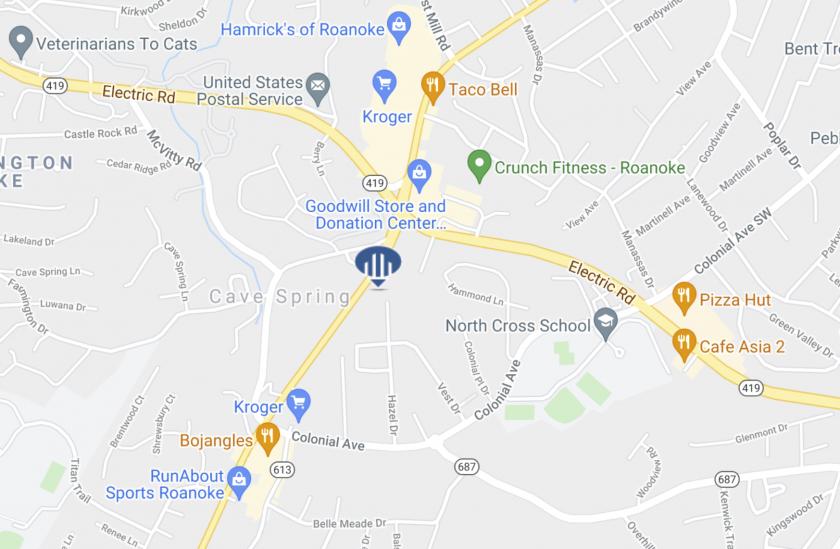
1-Mile | 3-Miles | 5-Miles | ||
---|---|---|---|---|
Total Population | 8,079 | 45,714 | 99,681 | |
Population Median Age | 44 | 43 | 41 | |
Population by Age | 0-9 Yrs | 778 (9%) | 5147 (11%) | 11484 (11%) |
10-19 Yrs | 849 (10%) | 4769 (10%) | 10794 (10%) | |
20-29 Yrs | 1019 (12%) | 5025 (10%) | 12795 (12%) | |
30-39 Yrs | 874 (10%) | 5308 (11%) | 12679 (12%) | |
40-49 Yrs | 989 (12%) | 6221 (13%) | 12795 (12%) | |
50-59 Yrs | 1039 (12%) | 5955 (13%) | 13429 (13%) | |
60-69 Yrs | 1178 (14%) | 6117 (13%) | 12319 (12%) | |
70+ Yrs | 1353 (16%) | 7172 (15%) | 13386 (13%) | |
Median HH Income | $67,761 | $65,914 | $55,913 | |
Total Household Income | < 24K | 598 (17%) | 2983 (14%) | 9529 (22%) |
25-49K | 560 (16%) | 4316 (21%) | 9798 (22%) | |
50-74K | 766 (22%) | 4124 (20%) | 8309 (19%) | |
75-99K | 488 (14%) | 2500 (12%) | 4961 (11%) | |
100-199K | 823 (23%) | 4627 (23%) | 7728 (17%) | |
200K+ | 205 (5%) | 1522 (7%) | 2818 (6%) | |
Highest Education Level | No Diploma | 426 | 1927 | 7084 |
Diploma or GED | 1203 | 6053 | 17977 | |
Some College | 1005 | 6150 | 12959 | |
Assoc. Degree | 665 | 3613 | 7256 | |
Bachelors Degree | 1589 | 9420 | 15701 | |
Higher Degree | 1064 | 6498 | 10816 | |
Total Housing Units | 3,719 | 21,883 | 48,135 | |
--Owner-Occupied | 2,174 | 12,991 | 24,855 | |
--Renter-Occupied | 1,266 | 7,082 | 18,287 | |
Owner-Occupied Values | < 100K | 15 | 552 | 3312 |
100-199K | 975 | 4903 | 9699 | |
200-299K | 827 | 4286 | 6152 | |
300-399K | 281 | 1758 | 2930 | |
400-499K | 45 | 678 | 1196 | |
500K+ | 30 | 815 | 1567 | |
Total Working Age Population | 6,822 | 37,778 | 81,688 | |
In Work Force | 4,301 | 24,329 | 51,791 | |
Not In Work Force | 2,521 | 13,449 | 29,898 | |
Workforce Employed | 4,141 | 23,511 | 49,631 | |
Workforce Unemployed | 160 | 802 | 2,108 | |
Civlian Workforce | 4,301 | 24,313 | 51,739 | |
Military Workforce | 0 | 16 | 51 | |
Total Households | 3,440 | 20,072 | 43,142 | |
Family Households | 2,158 | 12,314 | 24,568 | |
Non-Family Households | 1,282 | 7,758 | 18,574 | |
Married Couple | 1,703 | 9,626 | 17,401 | |
Other Family | 454 | 2,688 | 7,167 | |
Married w/Child | 592 | 3,283 | 5,694 | |
Single Male w/Child | 89 | 593 | 985 | |
Single Female w/Child | 228 | 1,095 | 3,091 |
Population Change Last Two Decades - Plus Projection
2000 | % | 2010 | % | 2020 | % | 2030 | |
---|---|---|---|---|---|---|---|
Virginia | 7,078,515 | +13 | 8,001,024 | +8 | 8,655,021 | +8 | 9,331,666 |
Franklin County | 47,286 | +19 | 56,159 | 0 | 56,237 | +7 | 60,354 |
Roanoke County | 85,778 | +8 | 92,376 | +2 | 94,145 | +3 | 97,249 |
Roanoke city | 94,911 | +2 | 97,032 | +4 | 100,891 | +1 | 102,388 |
Salem city | 24,747 | 0 | 24,802 | +5 | 25,953 | +1 | 26,141 |
Total Working Age Population:
Total Households:
Total Working Age Population:
Total Households:
Total Working Age Population:
Total Households: