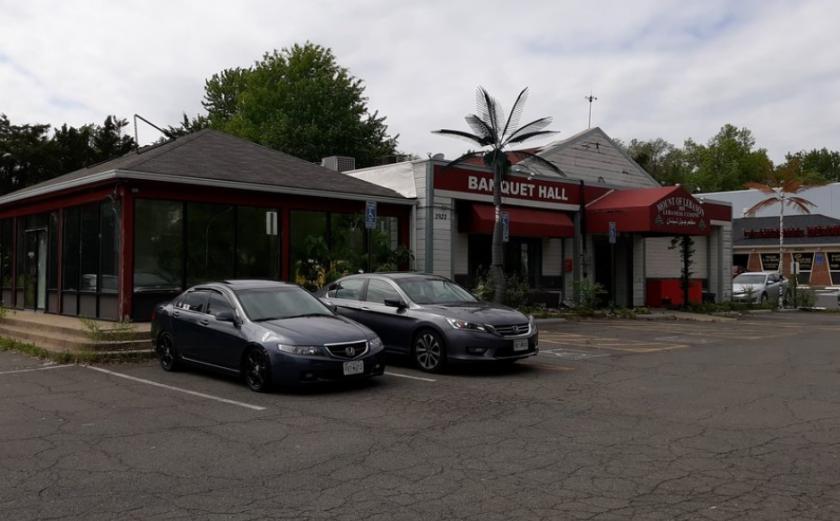
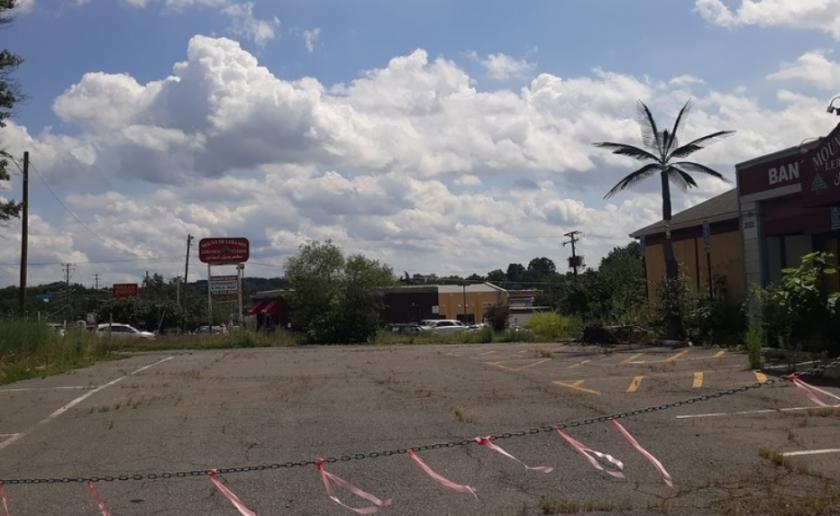
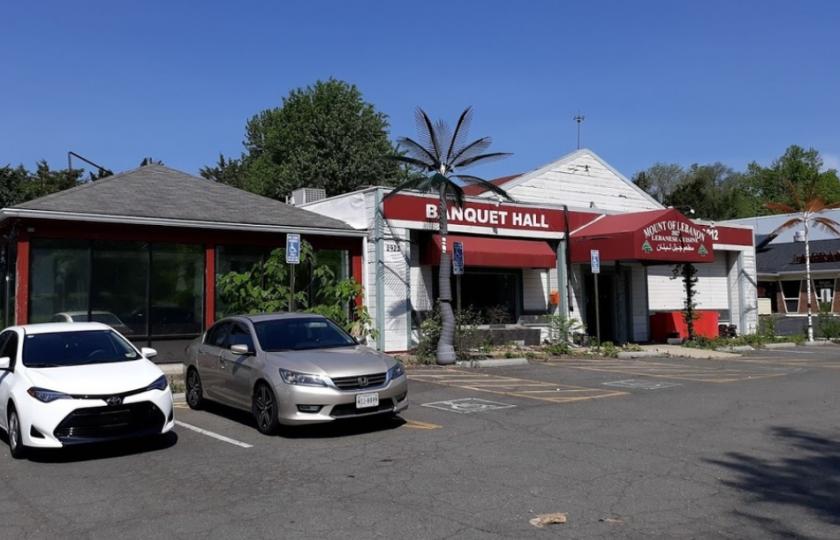
1-Mile | 3-Miles | 5-Miles | ||
---|---|---|---|---|
Total Population | 20,032 | 164,731 | 505,984 | |
Population Median Age | 39 | 38 | 38 | |
Population by Age | 0-9 Yrs | 2527 (12%) | 22623 (13%) | 64580 (12%) |
10-19 Yrs | 2304 (11%) | 18898 (11%) | 51864 (10%) | |
20-29 Yrs | 2334 (11%) | 20958 (12%) | 74677 (14%) | |
30-39 Yrs | 3115 (15%) | 26166 (15%) | 90217 (17%) | |
40-49 Yrs | 3058 (15%) | 23684 (14%) | 71290 (14%) | |
50-59 Yrs | 2720 (13%) | 21112 (12%) | 61999 (12%) | |
60-69 Yrs | 2391 (11%) | 17459 (10%) | 49909 (9%) | |
70+ Yrs | 1582 (7%) | 13830 (8%) | 41449 (8%) | |
Median HH Income | $118,967 | $123,277 | $110,917 | |
Total Household Income | < 24K | 565 (7%) | 4974 (8%) | 18511 (9%) |
25-49K | 723 (10%) | 6321 (10%) | 22220 (11%) | |
50-74K | 741 (10%) | 6263 (10%) | 25122 (12%) | |
75-99K | 834 (11%) | 6316 (10%) | 24055 (12%) | |
100-199K | 2570 (35%) | 19162 (32%) | 63151 (31%) | |
200K+ | 1749 (24%) | 15846 (26%) | 44560 (22%) | |
Highest Education Level | No Diploma | 1480 | 12575 | 32256 |
Diploma or GED | 1826 | 14096 | 43063 | |
Some College | 1836 | 11747 | 40755 | |
Assoc. Degree | 685 | 5274 | 16858 | |
Bachelors Degree | 4251 | 33823 | 110314 | |
Higher Degree | 4149 | 36874 | 116700 | |
Total Housing Units | 7,512 | 61,847 | 209,676 | |
--Owner-Occupied | 4,699 | 37,504 | 103,931 | |
--Renter-Occupied | 2,484 | 21,378 | 93,688 | |
Owner-Occupied Values | < 100K | 5 | 205 | 872 |
100-199K | 107 | 1455 | 4928 | |
200-299K | 175 | 1670 | 8394 | |
300-399K | 406 | 2229 | 9150 | |
400-499K | 893 | 4703 | 13223 | |
500K+ | 3113 | 27241 | 67364 | |
Total Working Age Population | 16,023 | 130,129 | 408,929 | |
In Work Force | 11,936 | 94,978 | 303,563 | |
Not In Work Force | 4,086 | 35,151 | 105,366 | |
Workforce Employed | 11,355 | 91,005 | 290,953 | |
Workforce Unemployed | 484 | 3,205 | 9,780 | |
Civlian Workforce | 11,839 | 94,210 | 300,733 | |
Military Workforce | 97 | 768 | 2,830 | |
Total Households | 7,183 | 58,882 | 197,619 | |
Family Households | 4,893 | 39,696 | 115,855 | |
Non-Family Households | 2,290 | 19,186 | 81,764 | |
Married Couple | 3,802 | 31,646 | 90,369 | |
Other Family | 1,091 | 8,050 | 25,486 | |
Married w/Child | 1,854 | 15,747 | 43,274 | |
Single Male w/Child | 93 | 1,026 | 2,845 | |
Single Female w/Child | 416 | 2,666 | 8,868 |
Population Change Last Two Decades - Plus Projection
2000 | % | 2010 | % | 2020 | % | 2030 | |
---|---|---|---|---|---|---|---|
District of Columbia | 572,059 | +5 | 601,723 | +21 | 729,501 | +15 | 842,154 |
Maryland | 5,296,486 | +9 | 5,773,552 | +6 | 6,141,900 | +6 | 6,518,750 |
Montgomery County | 873,341 | +11 | 971,777 | +8 | 1,052,050 | +7 | 1,128,800 |
Prince Georges County | 801,515 | +8 | 863,420 | +6 | 916,150 | +4 | 952,950 |
Virginia | 7,078,515 | +13 | 8,001,024 | +8 | 8,655,021 | +8 | 9,331,666 |
Arlington County | 189,453 | +10 | 207,627 | +20 | 249,298 | +10 | 274,339 |
Fairfax County | 969,749 | +12 | 1,081,726 | +7 | 1,162,504 | +7 | 1,244,025 |
Prince William County | 280,813 | +43 | 402,002 | +19 | 478,134 | +20 | 571,844 |
Alexandria city | 128,283 | +9 | 139,966 | +19 | 166,261 | +10 | 182,067 |
Falls Church city | 10,377 | +19 | 12,332 | +22 | 14,988 | +14 | 17,032 |
Total Working Age Population:
Total Households:
Total Working Age Population:
Total Households:
Total Working Age Population:
Total Households: