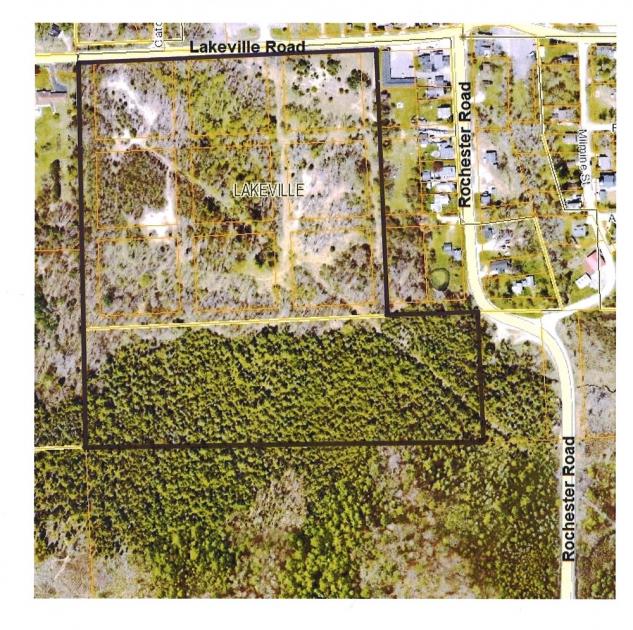
1-Mile | 3-Miles | 5-Miles | ||
---|---|---|---|---|
Total Population | 795 | 7,172 | 23,568 | |
Population Median Age | 42 | 42 | 40 | |
Population by Age | 0-9 Yrs | 75 (9%) | 800 (11%) | 2906 (12%) |
10-19 Yrs | 107 (13%) | 892 (12%) | 3170 (13%) | |
20-29 Yrs | 82 (10%) | 716 (9%) | 2454 (10%) | |
30-39 Yrs | 55 (6%) | 637 (8%) | 2516 (10%) | |
40-49 Yrs | 117 (14%) | 1018 (14%) | 3599 (15%) | |
50-59 Yrs | 164 (20%) | 1311 (18%) | 3720 (15%) | |
60-69 Yrs | 99 (12%) | 948 (13%) | 2901 (12%) | |
70+ Yrs | 95 (11%) | 850 (11%) | 2303 (9%) | |
Median HH Income | $87,330 | $87,890 | $94,470 | |
Total Household Income | < 24K | 42 (15%) | 332 (13%) | 798 (9%) |
25-49K | 40 (14%) | 384 (15%) | 1199 (14%) | |
50-74K | 38 (13%) | 378 (14%) | 1277 (15%) | |
75-99K | 37 (13%) | 334 (13%) | 1090 (13%) | |
100-199K | 78 (28%) | 740 (29%) | 2676 (32%) | |
200K+ | 41 (14%) | 364 (14%) | 1205 (14%) | |
Highest Education Level | No Diploma | 42 | 372 | 953 |
Diploma or GED | 121 | 1242 | 3397 | |
Some College | 144 | 1160 | 3599 | |
Assoc. Degree | 51 | 462 | 1717 | |
Bachelors Degree | 88 | 880 | 3543 | |
Higher Degree | 108 | 881 | 2788 | |
Total Housing Units | 300 | 2,758 | 8,657 | |
--Owner-Occupied | 250 | 2,355 | 7,560 | |
--Renter-Occupied | 27 | 178 | 684 | |
Owner-Occupied Values | < 100K | 9 | 334 | 809 |
100-199K | 37 | 271 | 1203 | |
200-299K | 60 | 509 | 1760 | |
300-399K | 72 | 592 | 1879 | |
400-499K | 42 | 326 | 869 | |
500K+ | 31 | 323 | 1040 | |
Total Working Age Population | 673 | 5,908 | 18,709 | |
In Work Force | 434 | 3,825 | 12,325 | |
Not In Work Force | 239 | 2,083 | 6,384 | |
Workforce Employed | 411 | 3,616 | 11,651 | |
Workforce Unemployed | 23 | 209 | 673 | |
Civlian Workforce | 434 | 3,825 | 12,325 | |
Military Workforce | 0 | 0 | 0 | |
Total Households | 277 | 2,533 | 8,244 | |
Family Households | 199 | 1,905 | 6,534 | |
Non-Family Households | 78 | 628 | 1,710 | |
Married Couple | 175 | 1,611 | 5,363 | |
Other Family | 24 | 294 | 1,171 | |
Married w/Child | 59 | 581 | 2,147 | |
Single Male w/Child | 4 | 45 | 214 | |
Single Female w/Child | 7 | 65 | 360 |
Population Change Last Two Decades - Plus Projection
2000 | % | 2010 | % | 2020 | % | 2030 | |
---|---|---|---|---|---|---|---|
Michigan | 9,938,444 | -1 | 9,883,640 | +1 | 10,023,423 | +4 | 10,424,510 |
Lapeer County | 87,904 | 0 | 88,319 | 0 | 88,351 | +1 | 89,343 |
Macomb County | 788,149 | +7 | 840,978 | +5 | 883,020 | +6 | 933,965 |
Oakland County | 1,194,156 | +1 | 1,202,362 | +5 | 1,264,515 | +7 | 1,350,052 |
Total Working Age Population:
Total Households:
Total Working Age Population:
Total Households:
Total Working Age Population:
Total Households: