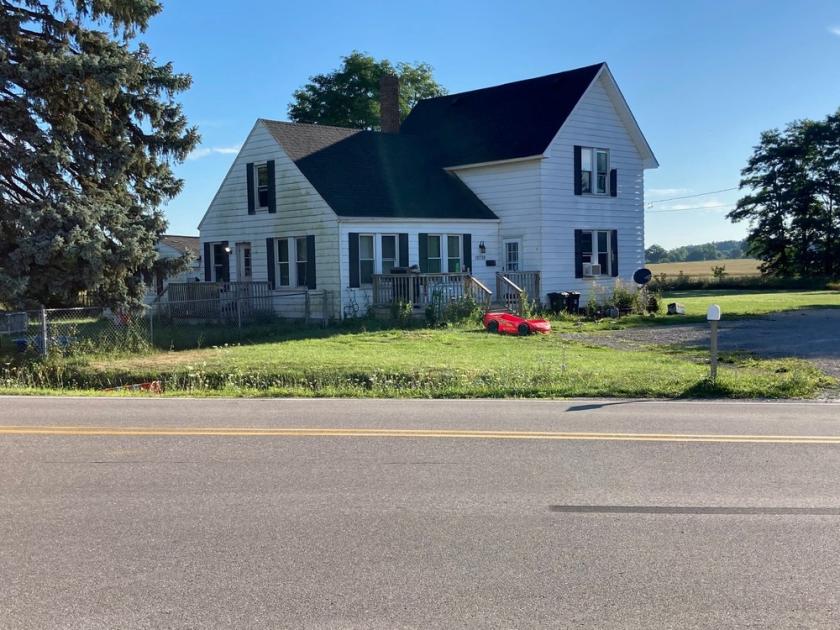
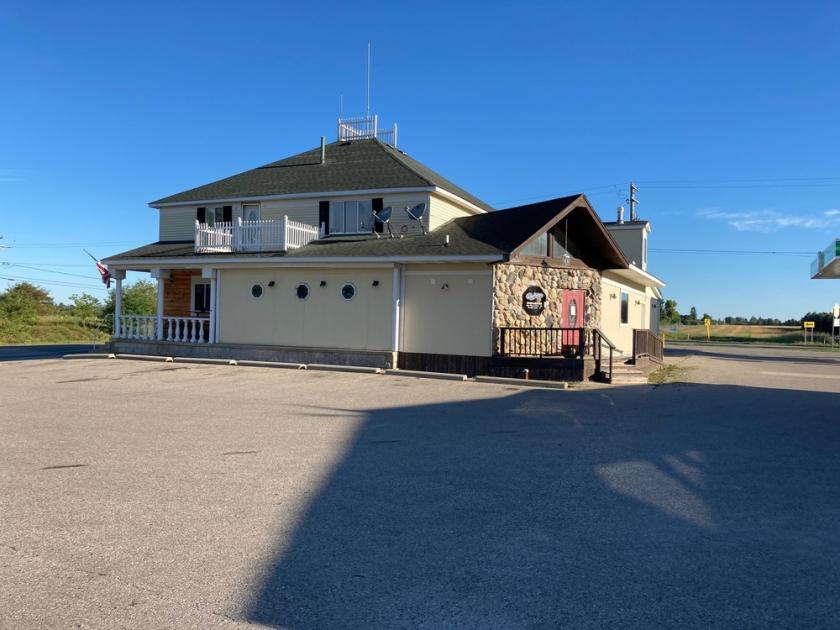
1-Mile | 3-Miles | 5-Miles | ||
---|---|---|---|---|
Total Population | 173 | 1,561 | 6,371 | |
Population Median Age | 41 | 41 | 40 | |
Population by Age | 0-9 Yrs | 19 (10%) | 171 (10%) | 718 (11%) |
10-19 Yrs | 24 (13%) | 222 (14%) | 901 (14%) | |
20-29 Yrs | 12 (6%) | 110 (7%) | 647 (10%) | |
30-39 Yrs | 22 (12%) | 192 (12%) | 680 (10%) | |
40-49 Yrs | 24 (13%) | 229 (14%) | 865 (13%) | |
50-59 Yrs | 32 (18%) | 282 (18%) | 1078 (16%) | |
60-69 Yrs | 26 (15%) | 224 (14%) | 809 (12%) | |
70+ Yrs | 15 (8%) | 132 (8%) | 673 (10%) | |
Median HH Income | $75,240 | $74,598 | $63,165 | |
Total Household Income | < 24K | 8 (12%) | 67 (11%) | 421 (17%) |
25-49K | 13 (19%) | 120 (20%) | 560 (23%) | |
50-74K | 12 (18%) | 107 (18%) | 430 (17%) | |
75-99K | 12 (18%) | 101 (17%) | 391 (16%) | |
100-199K | 18 (27%) | 171 (29%) | 560 (23%) | |
200K+ | 2 (3%) | 20 (3%) | 59 (2%) | |
Highest Education Level | No Diploma | 9 | 75 | 406 |
Diploma or GED | 54 | 464 | 1837 | |
Some College | 30 | 269 | 1098 | |
Assoc. Degree | 14 | 128 | 450 | |
Bachelors Degree | 11 | 112 | 388 | |
Higher Degree | 6 | 52 | 187 | |
Total Housing Units | 70 | 627 | 2,590 | |
--Owner-Occupied | 62 | 554 | 2,014 | |
--Renter-Occupied | 3 | 32 | 408 | |
Owner-Occupied Values | < 100K | 10 | 85 | 576 |
100-199K | 28 | 249 | 825 | |
200-299K | 19 | 163 | 452 | |
300-399K | 4 | 39 | 110 | |
400-499K | 0 | 6 | 19 | |
500K+ | 1 | 11 | 33 | |
Total Working Age Population | 139 | 1,248 | 5,080 | |
In Work Force | 85 | 780 | 3,066 | |
Not In Work Force | 54 | 468 | 2,014 | |
Workforce Employed | 80 | 739 | 2,881 | |
Workforce Unemployed | 4 | 37 | 175 | |
Civlian Workforce | 85 | 775 | 3,057 | |
Military Workforce | 1 | 4 | 10 | |
Total Households | 66 | 586 | 2,422 | |
Family Households | 52 | 458 | 1,734 | |
Non-Family Households | 14 | 128 | 688 | |
Married Couple | 44 | 391 | 1,383 | |
Other Family | 8 | 67 | 351 | |
Married w/Child | 16 | 146 | 525 | |
Single Male w/Child | 2 | 16 | 64 | |
Single Female w/Child | 2 | 18 | 97 |
Population Change Last Two Decades - Plus Projection
2000 | % | 2010 | % | 2020 | % | 2030 | |
---|---|---|---|---|---|---|---|
Michigan | 9,938,444 | -1 | 9,883,640 | +1 | 10,023,423 | +4 | 10,424,510 |
St. Clair County | 164,235 | -1 | 163,040 | -3 | 158,894 | 0 | 158,698 |
Total Working Age Population:
Total Households:
Total Working Age Population:
Total Households:
Total Working Age Population:
Total Households: