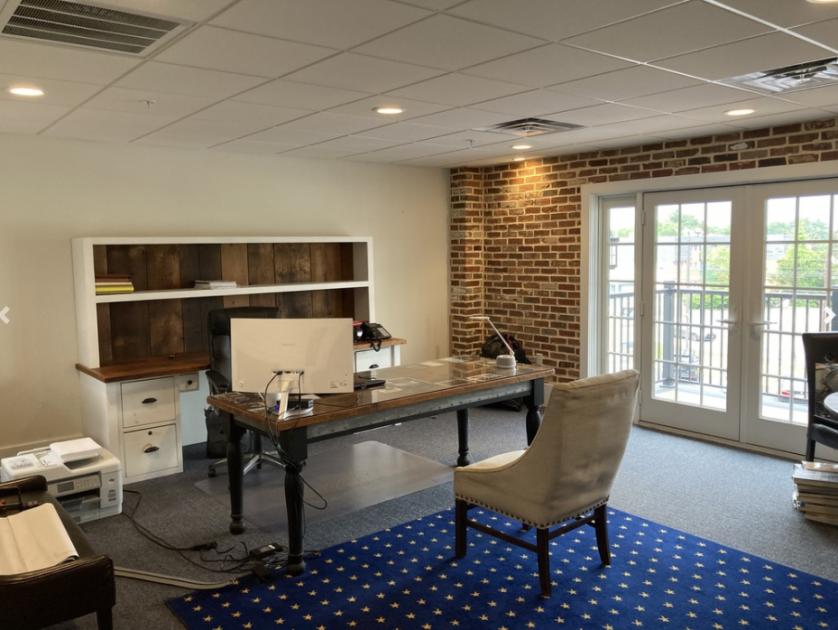
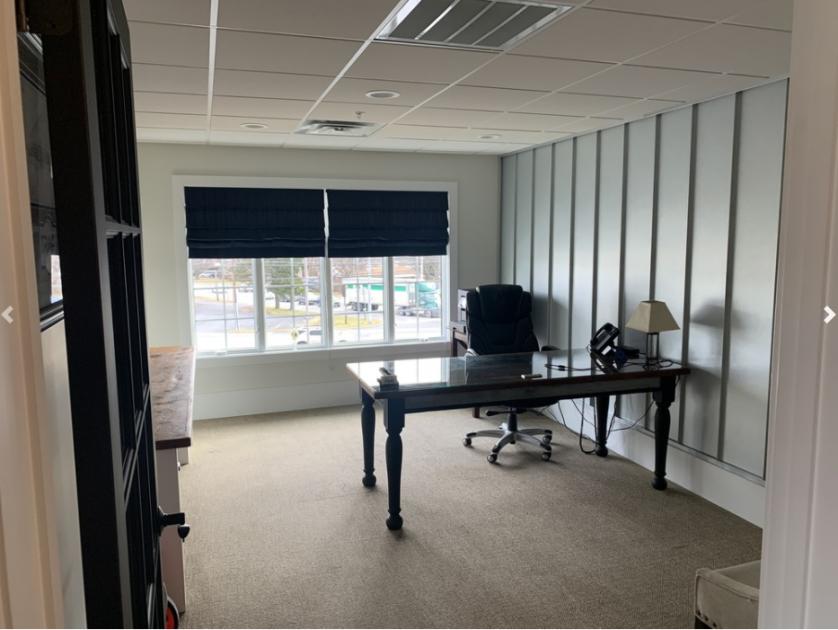
1-Mile | 3-Miles | 5-Miles | ||
---|---|---|---|---|
Total Population | 7,607 | 66,545 | 169,755 | |
Population Median Age | 43 | 41 | 40 | |
Population by Age | 0-9 Yrs | 823 (10%) | 7782 (11%) | 18368 (10%) |
10-19 Yrs | 932 (12%) | 7385 (11%) | 17211 (10%) | |
20-29 Yrs | 794 (10%) | 7662 (11%) | 24091 (14%) | |
30-39 Yrs | 886 (11%) | 9499 (14%) | 24294 (14%) | |
40-49 Yrs | 1083 (14%) | 9061 (13%) | 23709 (13%) | |
50-59 Yrs | 823 (10%) | 8628 (12%) | 22923 (13%) | |
60-69 Yrs | 1047 (13%) | 7928 (11%) | 19848 (11%) | |
70+ Yrs | 1218 (16%) | 8600 (12%) | 19310 (11%) | |
Median HH Income | $80,123 | $79,612 | $67,514 | |
Total Household Income | < 24K | 375 (11%) | 2960 (11%) | 10828 (14%) |
25-49K | 572 (17%) | 5271 (19%) | 16784 (22%) | |
50-74K | 559 (17%) | 4431 (16%) | 13371 (17%) | |
75-99K | 424 (13%) | 4155 (15%) | 10822 (14%) | |
100-199K | 967 (30%) | 7672 (28%) | 18123 (24%) | |
200K+ | 289 (9%) | 2369 (8%) | 5157 (6%) | |
Highest Education Level | No Diploma | 250 | 2895 | 9431 |
Diploma or GED | 1358 | 12899 | 33026 | |
Some College | 787 | 7398 | 19647 | |
Assoc. Degree | 353 | 3807 | 10230 | |
Bachelors Degree | 1769 | 13185 | 32256 | |
Higher Degree | 961 | 8007 | 19815 | |
Total Housing Units | 3,346 | 28,373 | 82,621 | |
--Owner-Occupied | 2,193 | 18,475 | 44,671 | |
--Renter-Occupied | 992 | 8,384 | 30,414 | |
Owner-Occupied Values | < 100K | 66 | 1074 | 3984 |
100-199K | 699 | 6833 | 19274 | |
200-299K | 787 | 6023 | 12249 | |
300-399K | 367 | 2560 | 4808 | |
400-499K | 157 | 1241 | 2378 | |
500K+ | 118 | 743 | 1978 | |
Total Working Age Population | 6,174 | 54,142 | 140,937 | |
In Work Force | 4,115 | 35,051 | 95,036 | |
Not In Work Force | 2,058 | 19,091 | 45,900 | |
Workforce Employed | 3,977 | 33,708 | 91,514 | |
Workforce Unemployed | 137 | 1,263 | 3,354 | |
Civlian Workforce | 4,114 | 34,971 | 94,868 | |
Military Workforce | 1 | 80 | 168 | |
Total Households | 3,185 | 26,859 | 75,085 | |
Family Households | 1,929 | 16,875 | 41,141 | |
Non-Family Households | 1,256 | 9,983 | 33,944 | |
Married Couple | 1,659 | 13,760 | 31,882 | |
Other Family | 270 | 3,115 | 9,259 | |
Married w/Child | 671 | 5,514 | 11,537 | |
Single Male w/Child | 18 | 484 | 1,385 | |
Single Female w/Child | 112 | 1,277 | 3,807 |
Population Change Last Two Decades - Plus Projection
2000 | % | 2010 | % | 2020 | % | 2030 | |
---|---|---|---|---|---|---|---|
Pennsylvania | 12,281,054 | +3 | 12,702,379 | +4 | 13,230,170 | +4 | 13,759,594 |
Cumberland County | 213,674 | +10 | 235,406 | +7 | 251,836 | +6 | 268,063 |
Dauphin County | 251,798 | +6 | 268,100 | +4 | 279,506 | +3 | 289,132 |
Juniata County | 22,821 | +8 | 24,636 | 0 | 24,681 | +1 | 25,013 |
Perry County | 43,602 | +5 | 45,969 | +6 | 48,597 | +4 | 50,348 |
York County | 381,751 | +14 | 434,972 | +6 | 460,514 | +5 | 484,497 |
Total Working Age Population:
Total Households:
Total Working Age Population:
Total Households:
Total Working Age Population:
Total Households: