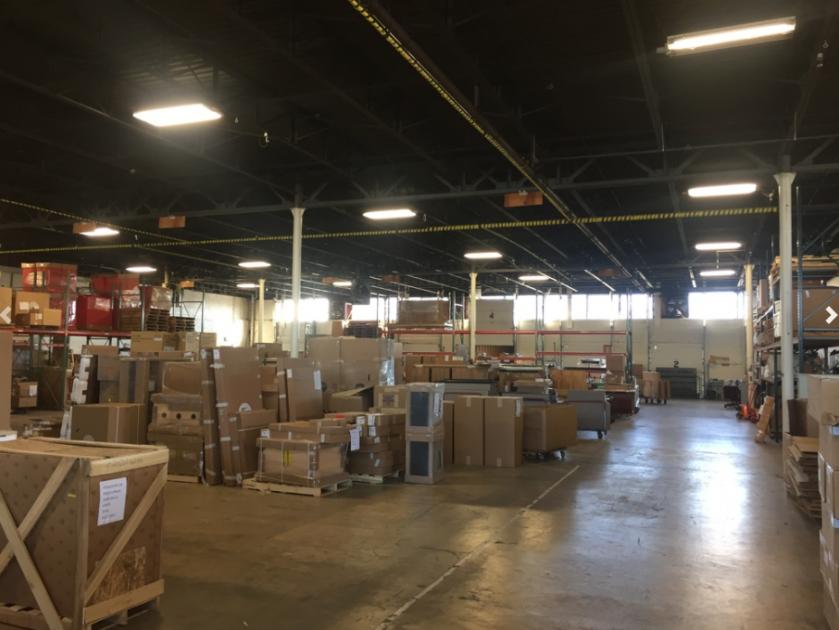
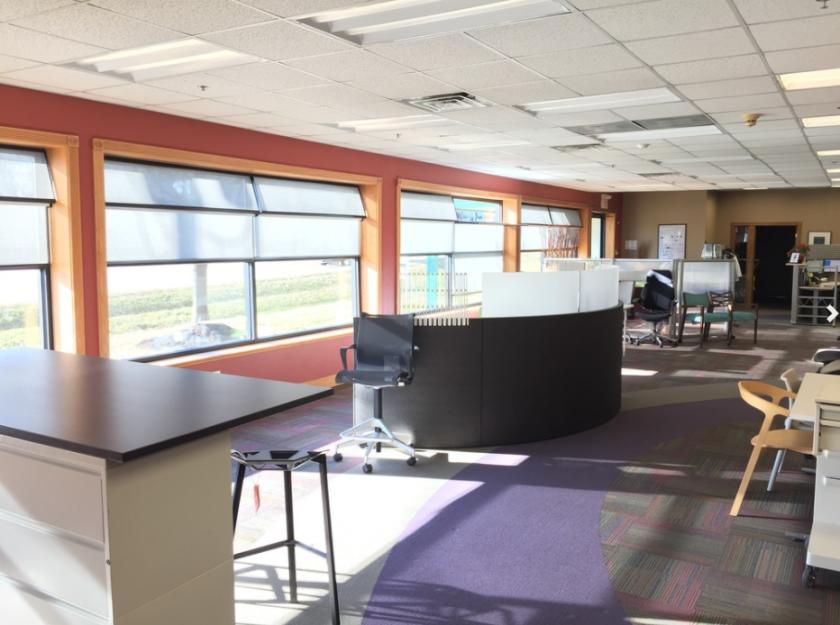
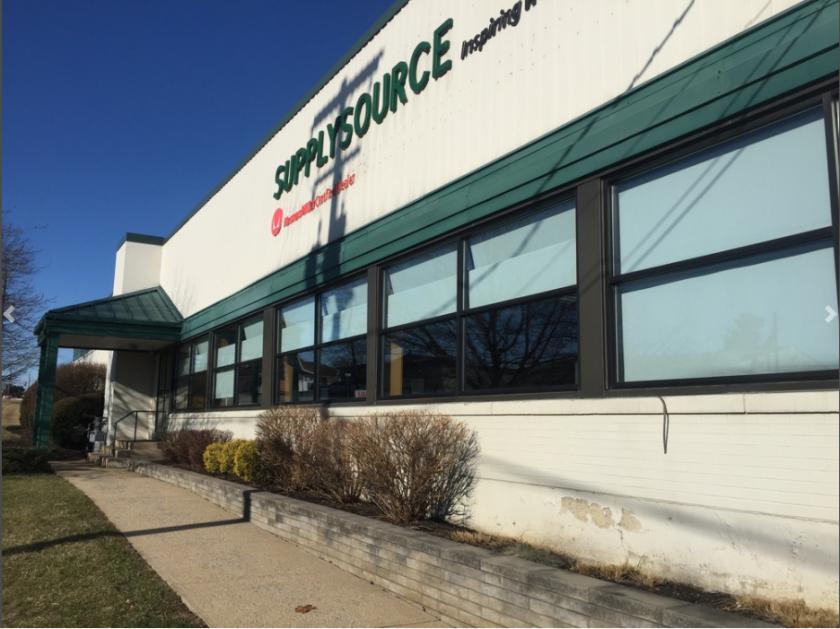
1-Mile | 3-Miles | 5-Miles | ||
---|---|---|---|---|
Total Population | 8,758 | 71,849 | 197,711 | |
Population Median Age | 40 | 41 | 39 | |
Population by Age | 0-9 Yrs | 893 (10%) | 7077 (9%) | 23387 (11%) |
10-19 Yrs | 723 (8%) | 6469 (9%) | 21730 (10%) | |
20-29 Yrs | 1430 (16%) | 10533 (14%) | 29987 (15%) | |
30-39 Yrs | 1578 (18%) | 11149 (15%) | 27817 (14%) | |
40-49 Yrs | 1198 (13%) | 9874 (13%) | 26242 (13%) | |
50-59 Yrs | 1149 (13%) | 9519 (13%) | 26669 (13%) | |
60-69 Yrs | 734 (8%) | 8164 (11%) | 21692 (10%) | |
70+ Yrs | 1053 (12%) | 9064 (12%) | 20187 (10%) | |
Median HH Income | $65,285 | $69,005 | $59,472 | |
Total Household Income | < 24K | 458 (14%) | 4439 (14%) | 14825 (17%) |
25-49K | 795 (25%) | 6705 (21%) | 20041 (23%) | |
50-74K | 506 (16%) | 5816 (18%) | 15795 (18%) | |
75-99K | 560 (17%) | 4872 (15%) | 11678 (13%) | |
100-199K | 729 (23%) | 7921 (25%) | 17644 (20%) | |
200K+ | 112 (3%) | 1674 (5%) | 4480 (5%) | |
Highest Education Level | No Diploma | 628 | 3720 | 13884 |
Diploma or GED | 2250 | 15012 | 40475 | |
Some College | 1187 | 8990 | 23664 | |
Assoc. Degree | 526 | 4573 | 11103 | |
Bachelors Degree | 1289 | 13749 | 32113 | |
Higher Degree | 791 | 8086 | 18880 | |
Total Housing Units | 3,345 | 34,351 | 94,860 | |
--Owner-Occupied | 1,750 | 18,432 | 46,851 | |
--Renter-Occupied | 1,410 | 12,995 | 37,612 | |
Owner-Occupied Values | < 100K | 72 | 1005 | 7540 |
100-199K | 1148 | 9531 | 20267 | |
200-299K | 367 | 4960 | 11513 | |
300-399K | 114 | 1716 | 4272 | |
400-499K | 37 | 677 | 1807 | |
500K+ | 11 | 543 | 1452 | |
Total Working Age Population | 7,423 | 60,926 | 160,795 | |
In Work Force | 3,948 | 39,495 | 106,990 | |
Not In Work Force | 3,476 | 21,431 | 53,805 | |
Workforce Employed | 3,846 | 38,154 | 101,788 | |
Workforce Unemployed | 101 | 1,302 | 5,015 | |
Civlian Workforce | 3,947 | 39,456 | 106,803 | |
Military Workforce | 0 | 39 | 186 | |
Total Households | 3,160 | 31,427 | 84,463 | |
Family Households | 1,864 | 16,902 | 46,649 | |
Non-Family Households | 1,296 | 14,526 | 37,814 | |
Married Couple | 1,357 | 13,251 | 32,435 | |
Other Family | 507 | 3,651 | 14,214 | |
Married w/Child | 529 | 4,639 | 11,558 | |
Single Male w/Child | 89 | 577 | 1,976 | |
Single Female w/Child | 207 | 1,342 | 6,017 |
Population Change Last Two Decades - Plus Projection
2000 | % | 2010 | % | 2020 | % | 2030 | |
---|---|---|---|---|---|---|---|
Pennsylvania | 12,281,054 | +3 | 12,702,379 | +4 | 13,230,170 | +4 | 13,759,594 |
Cumberland County | 213,674 | +10 | 235,406 | +7 | 251,836 | +6 | 268,063 |
Dauphin County | 251,798 | +6 | 268,100 | +4 | 279,506 | +3 | 289,132 |
Juniata County | 22,821 | +8 | 24,636 | 0 | 24,681 | +1 | 25,013 |
Perry County | 43,602 | +5 | 45,969 | +6 | 48,597 | +4 | 50,348 |
York County | 381,751 | +14 | 434,972 | +6 | 460,514 | +5 | 484,497 |
Total Working Age Population:
Total Households:
Total Working Age Population:
Total Households:
Total Working Age Population:
Total Households: