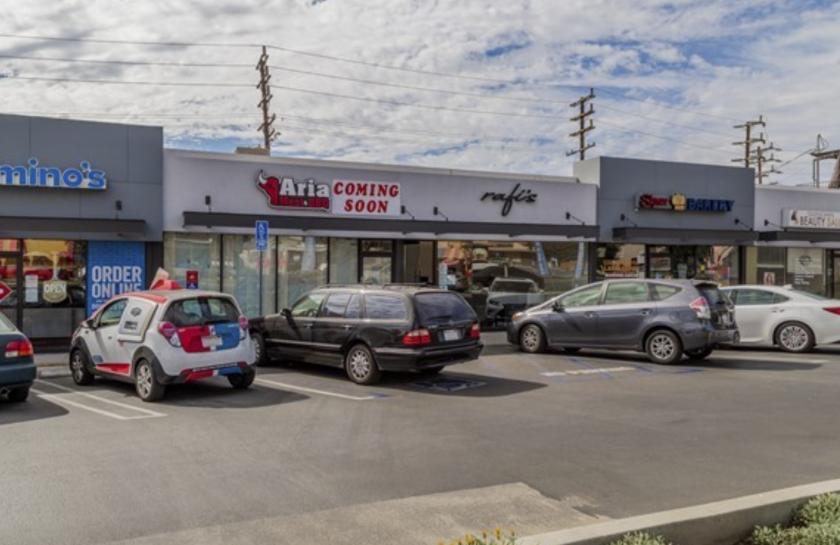
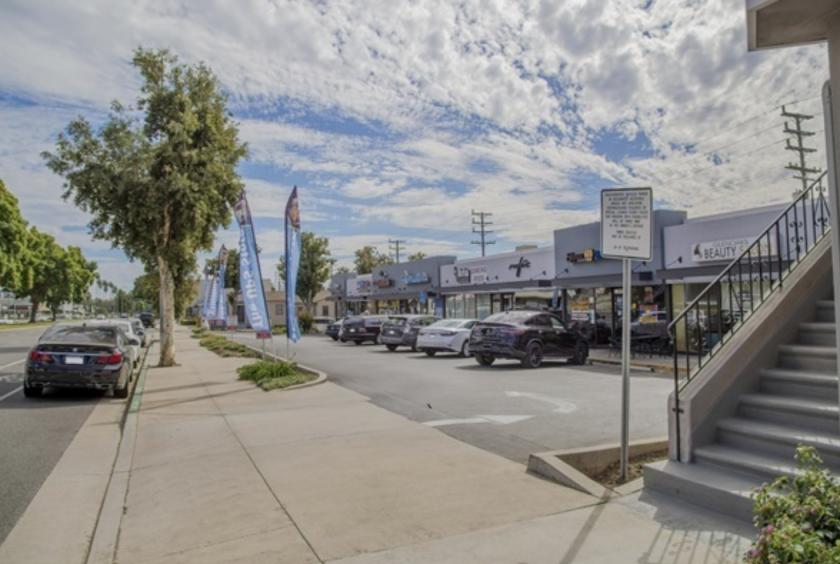
1-Mile | 3-Miles | 5-Miles | ||
---|---|---|---|---|
Total Population | 27,301 | 192,298 | 492,284 | |
Population Median Age | 43 | 41 | 41 | |
Population by Age | 0-9 Yrs | 2315 (8%) | 18347 (9%) | 46294 (9%) |
10-19 Yrs | 2699 (9%) | 17695 (9%) | 43975 (8%) | |
20-29 Yrs | 3456 (12%) | 27468 (14%) | 72442 (14%) | |
30-39 Yrs | 3858 (14%) | 30686 (15%) | 82679 (16%) | |
40-49 Yrs | 3380 (12%) | 24857 (12%) | 69479 (14%) | |
50-59 Yrs | 4700 (17%) | 27579 (14%) | 69457 (14%) | |
60-69 Yrs | 3515 (12%) | 21984 (11%) | 54078 (10%) | |
70+ Yrs | 3379 (12%) | 23682 (12%) | 53881 (10%) | |
Median HH Income | $63,487 | $63,059 | $70,151 | |
Total Household Income | < 24K | 2463 (24%) | 17611 (23%) | 40529 (20%) |
25-49K | 1528 (15%) | 13112 (17%) | 33848 (17%) | |
50-74K | 1573 (15%) | 12067 (16%) | 30267 (15%) | |
75-99K | 1052 (10%) | 8615 (11%) | 23346 (11%) | |
100-199K | 2290 (23%) | 16249 (21%) | 46940 (23%) | |
200K+ | 1004 (10%) | 6845 (9%) | 22846 (11%) | |
Highest Education Level | No Diploma | 3577 | 18794 | 42102 |
Diploma or GED | 4563 | 31105 | 66478 | |
Some College | 3455 | 24820 | 66540 | |
Assoc. Degree | 1999 | 15010 | 33470 | |
Bachelors Degree | 4417 | 36468 | 109888 | |
Higher Degree | 2745 | 19171 | 55930 | |
Total Housing Units | 10,285 | 78,622 | 212,972 | |
--Owner-Occupied | 3,142 | 21,250 | 67,757 | |
--Renter-Occupied | 6,768 | 53,250 | 130,020 | |
Owner-Occupied Values | < 100K | 31 | 310 | 920 |
100-199K | 9 | 147 | 447 | |
200-299K | 54 | 453 | 930 | |
300-399K | 95 | 1424 | 3136 | |
400-499K | 184 | 2170 | 5491 | |
500K+ | 2769 | 16745 | 56833 | |
Total Working Age Population | 23,311 | 163,423 | 419,783 | |
In Work Force | 14,419 | 103,391 | 279,029 | |
Not In Work Force | 8,893 | 60,031 | 140,755 | |
Workforce Employed | 13,397 | 96,353 | 260,826 | |
Workforce Unemployed | 1,021 | 6,869 | 17,931 | |
Civlian Workforce | 14,418 | 103,223 | 278,757 | |
Military Workforce | 1 | 169 | 272 | |
Total Households | 9,910 | 74,500 | 197,777 | |
Family Households | 6,979 | 47,063 | 112,740 | |
Non-Family Households | 2,931 | 27,437 | 85,037 | |
Married Couple | 4,965 | 33,826 | 82,517 | |
Other Family | 2,013 | 13,236 | 30,223 | |
Married w/Child | 2,067 | 13,343 | 32,547 | |
Single Male w/Child | 185 | 1,000 | 2,681 | |
Single Female w/Child | 212 | 2,802 | 7,282 |
Population Change Last Two Decades - Plus Projection
2000 | % | 2010 | % | 2020 | % | 2030 | |
---|---|---|---|---|---|---|---|
California | 33,871,648 | +10 | 37,253,956 | +9 | 40,467,295 | +8 | 43,631,295 |
Los Angeles County | 9,519,338 | +3 | 9,818,605 | +6 | 10,369,367 | +4 | 10,759,850 |
Total Working Age Population:
Total Households:
Total Working Age Population:
Total Households:
Total Working Age Population:
Total Households: