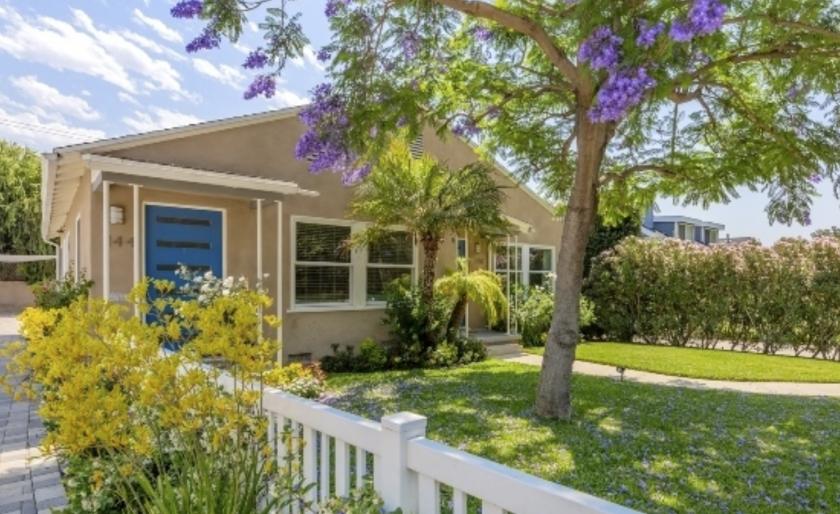
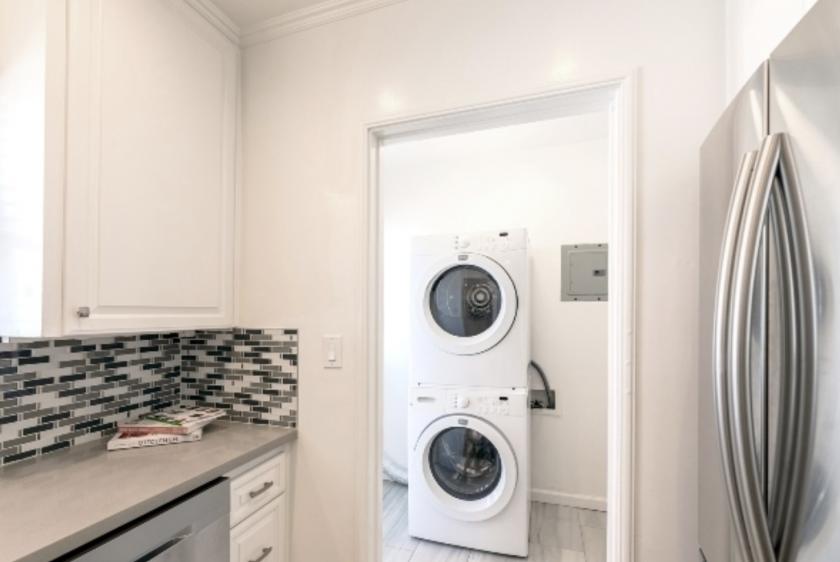
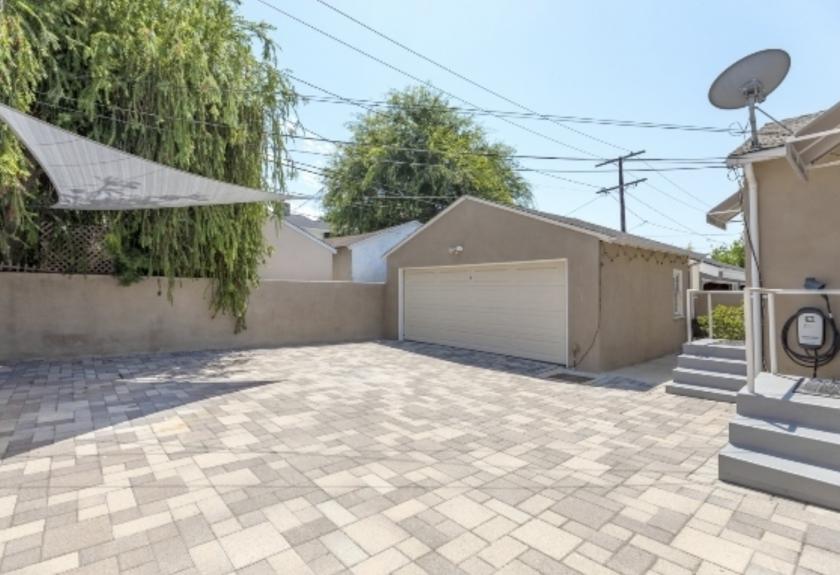
A rare opportunity to purchase a pride of ownership duplex in the San Rafael area of Pasadena! The property is a single story, side-by-side duplex built in 1940 and is comprised of two 2+1 units. Both units have central heating and air conditioning, Nest thermostat, and solar panels for both units were installed within the last 3 years. In 2017, the property was improved with new energy efficient windows, exterior doors including hardware, exterior light fixtures, awnings, a stucco coating and a new main line water service from the meter to the point of entry to the building. The building is copper plumbed, and the electrical service and subpanels have been updated. There are gutters and downspouts, a paving stone driveway and a 2-car garage. The property is beautifully landscaped and there is an outdoor seating area. 144 Avenue 64 was renovated in 2017 including a quartz countertop, tile backsplash, a stainless steel Zuhne sink and hood in the kitchen, tile floors in the kitchen and bathroom, interior door hardware and interior light fixtures. The unit also has the original red oak hardwood floors, recessed lighting in the kitchen and living room, and crown molding. It is equipped with stainless steel appliances (refrigerator, stove, dishwasher) and a washer/dryer. 146 Avenue 64 was last renovated approximately 15 years ago which included a tile countertop and backsplash, recessed lighting in the living room, interior door hardware and interior light fixtures. The unit has the original red oak hardwood floors and crown molding. It is equipped with stainless steel appliances (refrigerator, stove and microwave) and a washer/dryer. It also features a 30 amp, Clipper Creek electric vehicle charging station. Nearby amenities include the Little Flower café, Stoney Point Bar & Grill, San Rafael Park, San Rafael Branch Library, and San Rafael Elementary School (which offers a Spanish Dual Language Immersion Program - DLIP). The property is just 1.5 miles from Old Town Pasadena and the Rose Bowl.DISCLAIMER: All information provided herein together with any projections or other data has been furnished from sources which we deem reliable, but for which we assume no liability, expressed or implied. Interested parties are to conduct independent investigation and veri?cation of all information including but not limited to condition of the property, compliance or lack of compliance with applicable governmental requirements, any party’s intended use or any and all other matters.