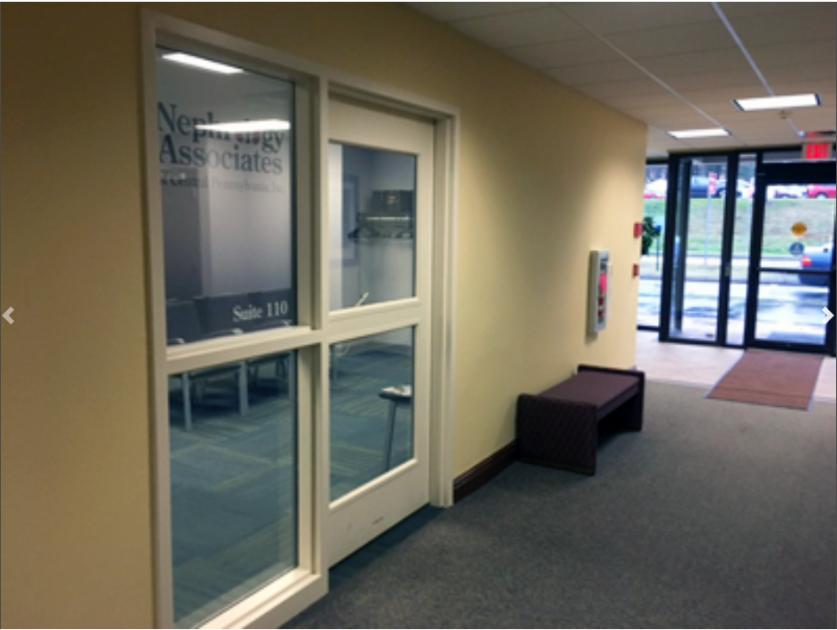
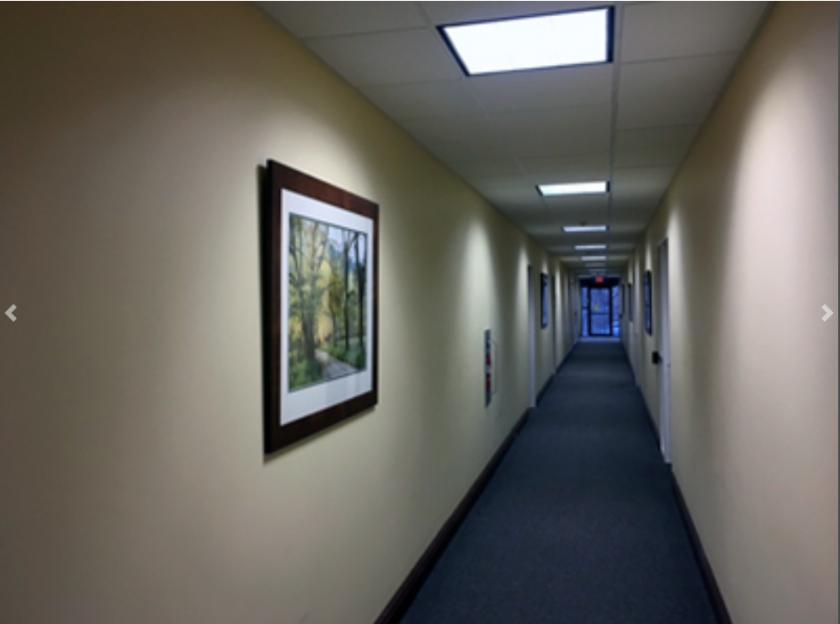
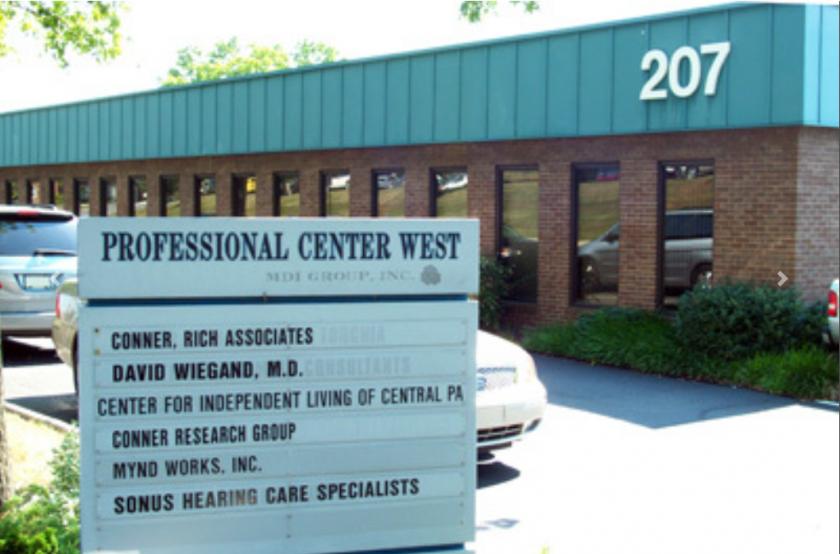
1-Mile | 3-Miles | 5-Miles | ||
---|---|---|---|---|
Total Population | 10,513 | 108,391 | 206,758 | |
Population Median Age | 41 | 39 | 39 | |
Population by Age | 0-9 Yrs | 1192 (11%) | 11994 (11%) | 24548 (11%) |
10-19 Yrs | 973 (9%) | 10410 (9%) | 23697 (11%) | |
20-29 Yrs | 1319 (12%) | 18298 (16%) | 31701 (15%) | |
30-39 Yrs | 1771 (16%) | 16032 (14%) | 28776 (13%) | |
40-49 Yrs | 1365 (12%) | 14707 (13%) | 27261 (13%) | |
50-59 Yrs | 1147 (10%) | 14267 (13%) | 27666 (13%) | |
60-69 Yrs | 1250 (11%) | 11982 (11%) | 22854 (11%) | |
70+ Yrs | 1496 (14%) | 10701 (9%) | 20255 (9%) | |
Median HH Income | $72,857 | $57,902 | $59,175 | |
Total Household Income | < 24K | 618 (13%) | 8997 (18%) | 15778 (17%) |
25-49K | 969 (20%) | 11755 (24%) | 20659 (23%) | |
50-74K | 806 (17%) | 8991 (18%) | 17006 (19%) | |
75-99K | 789 (16%) | 6641 (13%) | 12230 (13%) | |
100-199K | 1212 (25%) | 9807 (20%) | 17806 (20%) | |
200K+ | 269 (5%) | 2394 (4%) | 4421 (5%) | |
Highest Education Level | No Diploma | 545 | 8178 | 14953 |
Diploma or GED | 1987 | 21789 | 42636 | |
Some College | 1246 | 13240 | 24429 | |
Assoc. Degree | 536 | 6042 | 11515 | |
Bachelors Degree | 2159 | 18336 | 32326 | |
Higher Degree | 1432 | 11042 | 19303 | |
Total Housing Units | 5,001 | 56,042 | 98,790 | |
--Owner-Occupied | 2,606 | 24,297 | 48,212 | |
--Renter-Occupied | 2,057 | 24,287 | 39,688 | |
Owner-Occupied Values | < 100K | 80 | 3424 | 8367 |
100-199K | 1347 | 12049 | 21796 | |
200-299K | 698 | 5677 | 11188 | |
300-399K | 242 | 1744 | 3910 | |
400-499K | 114 | 789 | 1618 | |
500K+ | 126 | 614 | 1333 | |
Total Working Age Population | 8,749 | 90,156 | 167,485 | |
In Work Force | 6,037 | 60,592 | 111,214 | |
Not In Work Force | 2,712 | 29,564 | 56,271 | |
Workforce Employed | 5,863 | 58,039 | 105,708 | |
Workforce Unemployed | 175 | 2,503 | 5,346 | |
Civlian Workforce | 6,037 | 60,543 | 111,053 | |
Military Workforce | 0 | 49 | 161 | |
Total Households | 4,663 | 48,584 | 87,900 | |
Family Households | 2,613 | 24,078 | 48,665 | |
Non-Family Households | 2,050 | 24,506 | 39,235 | |
Married Couple | 2,017 | 17,068 | 32,893 | |
Other Family | 596 | 7,011 | 15,772 | |
Married w/Child | 803 | 5,816 | 11,917 | |
Single Male w/Child | 141 | 875 | 2,111 | |
Single Female w/Child | 216 | 3,017 | 6,771 |
Population Change Last Two Decades - Plus Projection
2000 | % | 2010 | % | 2020 | % | 2030 | |
---|---|---|---|---|---|---|---|
Pennsylvania | 12,281,054 | +3 | 12,702,379 | +4 | 13,230,170 | +4 | 13,759,594 |
Cumberland County | 213,674 | +10 | 235,406 | +7 | 251,836 | +6 | 268,063 |
Dauphin County | 251,798 | +6 | 268,100 | +4 | 279,506 | +3 | 289,132 |
Juniata County | 22,821 | +8 | 24,636 | 0 | 24,681 | +1 | 25,013 |
Perry County | 43,602 | +5 | 45,969 | +6 | 48,597 | +4 | 50,348 |
York County | 381,751 | +14 | 434,972 | +6 | 460,514 | +5 | 484,497 |
Total Working Age Population:
Total Households:
Total Working Age Population:
Total Households:
Total Working Age Population:
Total Households: