Office Space
3918 Prosperity Avenue Fairfax, VA 22031
3918 Prosperity Avenue Fairfax, VA 22031
Details & Description
Property Highlights
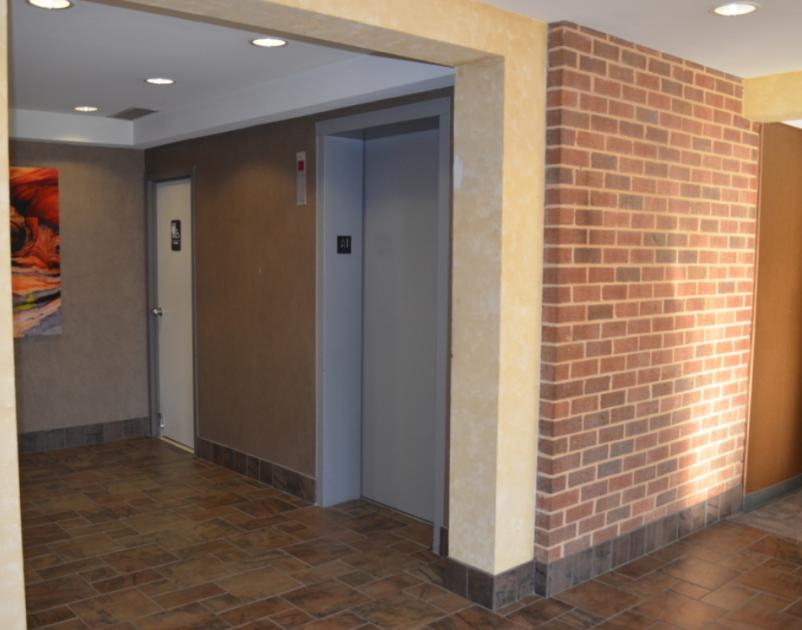
- • Elevator and beautiful lobby area
- • Bathrooms and kitchenettes in some suites
- • Lots of parking
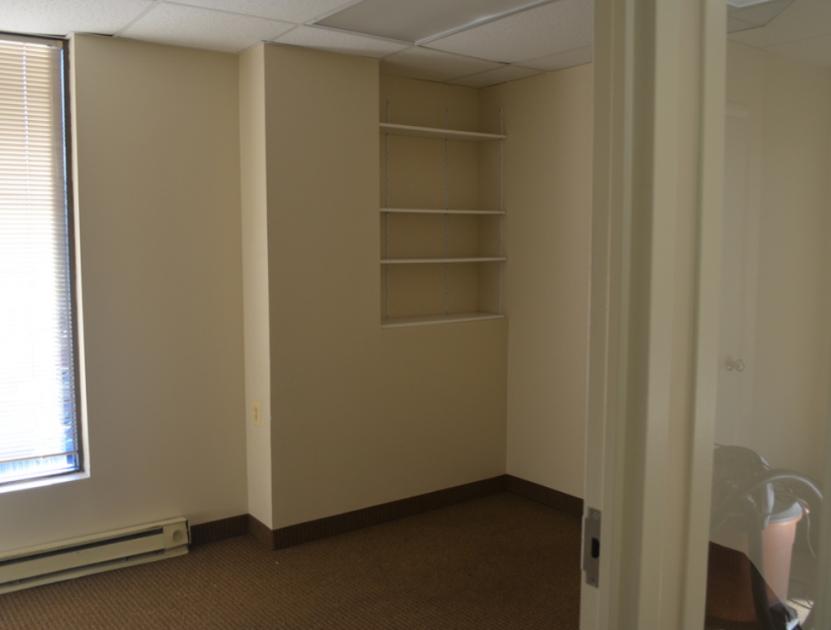
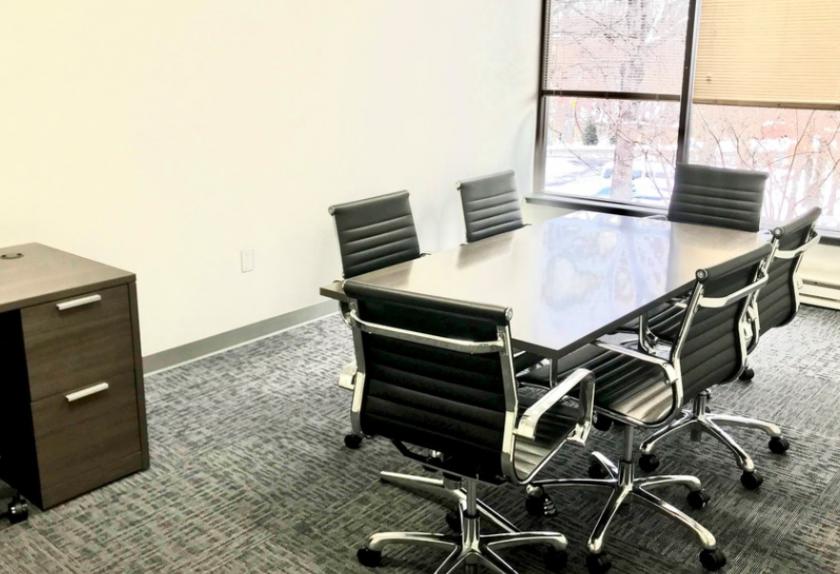
- • Windows in all suites with natural surroundings
Listing Agents

Jennifer Burke
O: 703-873-5734
M: 703-969-9519
jennifer.burke@lnf.com
O: 703-873-5734
M: 703-969-9519
jennifer.burke@lnf.com
While we strive to provide the most accurate information, all listing information, and demographic data, is provided by third-parties. As such, MyEListing will not be responsible for the accuracy of the information. It is strongly recommended that you verify all information with the listing agent, and any relevant agencies, prior to making any decisions.