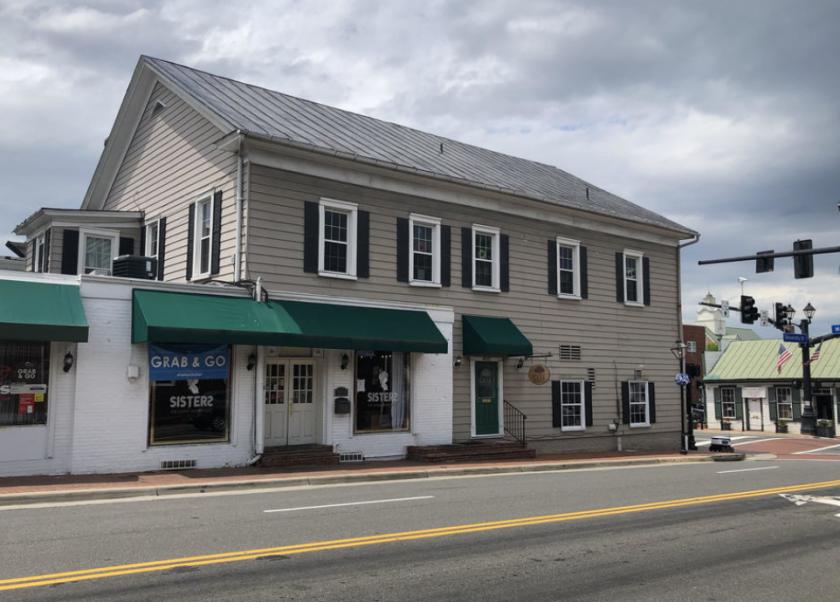
1-Mile | 3-Miles | 5-Miles | ||
---|---|---|---|---|
Total Population | 15,014 | 114,702 | 275,479 | |
Population Median Age | 38 | 37 | 38 | |
Population by Age | 0-9 Yrs | 1420 (9%) | 13067 (11%) | 32465 (11%) |
10-19 Yrs | 2300 (15%) | 16941 (14%) | 38326 (13%) | |
20-29 Yrs | 2790 (18%) | 17732 (15%) | 37396 (13%) | |
30-39 Yrs | 2036 (13%) | 16245 (14%) | 38486 (13%) | |
40-49 Yrs | 1622 (10%) | 15689 (13%) | 38342 (13%) | |
50-59 Yrs | 1989 (13%) | 14540 (12%) | 36975 (13%) | |
60-69 Yrs | 1299 (8%) | 11131 (9%) | 28976 (10%) | |
70+ Yrs | 1558 (10%) | 9359 (8%) | 24511 (8%) | |
Median HH Income | $130,041 | $126,392 | $131,545 | |
Total Household Income | < 24K | 307 (6%) | 3120 (8%) | 6121 (6%) |
25-49K | 552 (12%) | 3693 (9%) | 8365 (8%) | |
50-74K | 371 (8%) | 3901 (10%) | 9759 (10%) | |
75-99K | 374 (8%) | 4098 (10%) | 10498 (10%) | |
100-199K | 1657 (37%) | 14330 (36%) | 35761 (37%) | |
200K+ | 1191 (26%) | 9708 (24%) | 25218 (26%) | |
Highest Education Level | No Diploma | 773 | 4153 | 9017 |
Diploma or GED | 1323 | 8086 | 19990 | |
Some College | 1307 | 8660 | 22355 | |
Assoc. Degree | 486 | 4337 | 9892 | |
Bachelors Degree | 2779 | 24333 | 61467 | |
Higher Degree | 2922 | 24868 | 62404 | |
Total Housing Units | 4,599 | 40,233 | 99,339 | |
--Owner-Occupied | 3,368 | 25,619 | 66,393 | |
--Renter-Occupied | 1,084 | 13,231 | 29,329 | |
Owner-Occupied Values | < 100K | 57 | 433 | 822 |
100-199K | 64 | 380 | 1173 | |
200-299K | 94 | 1306 | 3730 | |
300-399K | 317 | 2344 | 6519 | |
400-499K | 678 | 4746 | 10911 | |
500K+ | 2158 | 16410 | 43238 | |
Total Working Age Population | 12,759 | 92,953 | 221,282 | |
In Work Force | 7,816 | 64,654 | 154,847 | |
Not In Work Force | 4,943 | 28,299 | 66,436 | |
Workforce Employed | 7,243 | 60,825 | 147,048 | |
Workforce Unemployed | 551 | 3,161 | 5,954 | |
Civlian Workforce | 7,794 | 63,986 | 153,002 | |
Military Workforce | 23 | 667 | 1,845 | |
Total Households | 4,451 | 38,850 | 95,723 | |
Family Households | 3,216 | 27,171 | 67,920 | |
Non-Family Households | 1,235 | 11,679 | 27,803 | |
Married Couple | 2,791 | 22,745 | 56,871 | |
Other Family | 425 | 4,426 | 11,048 | |
Married w/Child | 1,165 | 10,831 | 26,557 | |
Single Male w/Child | 32 | 467 | 1,348 | |
Single Female w/Child | 113 | 1,594 | 3,992 |
Population Change Last Two Decades - Plus Projection
2000 | % | 2010 | % | 2020 | % | 2030 | |
---|---|---|---|---|---|---|---|
Virginia | 7,078,515 | +13 | 8,001,024 | +8 | 8,655,021 | +8 | 9,331,666 |
Fairfax County | 969,749 | +12 | 1,081,726 | +7 | 1,162,504 | +7 | 1,244,025 |
Loudoun County | 169,599 | +84 | 312,311 | +38 | 430,584 | +29 | 554,808 |
Prince William County | 280,813 | +43 | 402,002 | +19 | 478,134 | +20 | 571,844 |
Fairfax city | 21,498 | +5 | 22,565 | +11 | 25,047 | +5 | 26,397 |
Total Working Age Population:
Total Households:
Total Working Age Population:
Total Households:
Total Working Age Population:
Total Households: