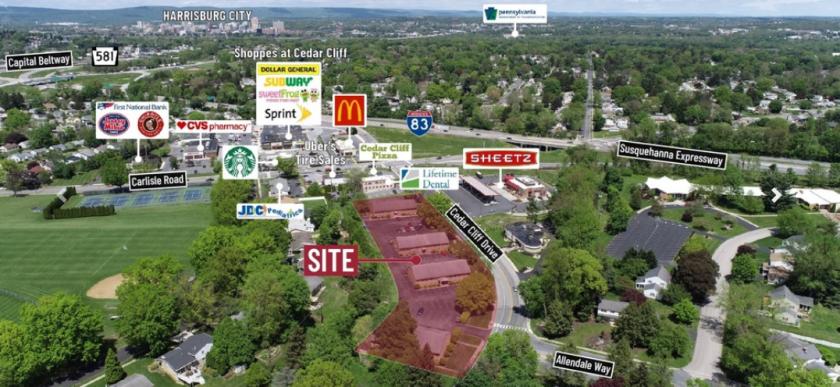
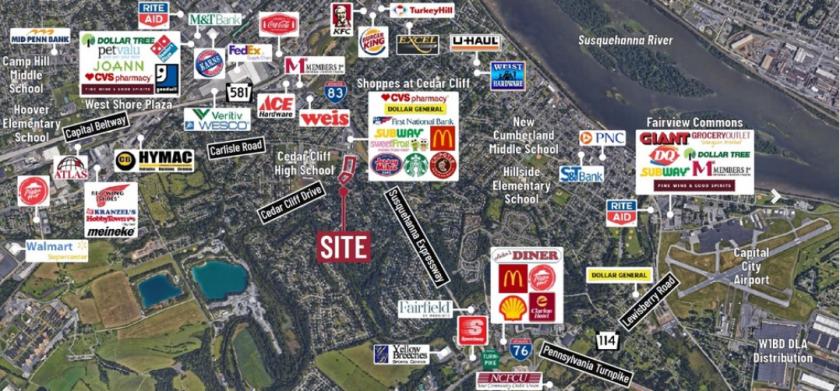
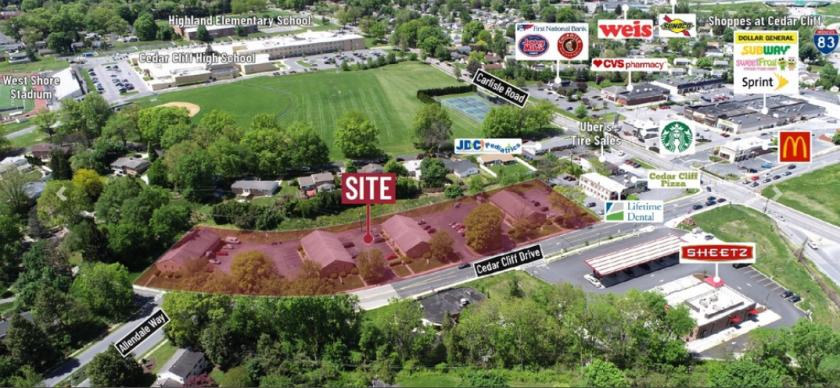
1-Mile | 3-Miles | 5-Miles | ||
---|---|---|---|---|
Total Population | 9,826 | 82,357 | 191,330 | |
Population Median Age | 43 | 39 | 39 | |
Population by Age | 0-9 Yrs | 920 (9%) | 9648 (11%) | 22313 (11%) |
10-19 Yrs | 984 (10%) | 7682 (9%) | 21122 (11%) | |
20-29 Yrs | 1142 (11%) | 14170 (17%) | 30407 (15%) | |
30-39 Yrs | 1368 (13%) | 12848 (15%) | 26608 (13%) | |
40-49 Yrs | 1229 (12%) | 10691 (12%) | 24832 (12%) | |
50-59 Yrs | 1564 (15%) | 11233 (13%) | 25992 (13%) | |
60-69 Yrs | 1188 (12%) | 8256 (10%) | 21019 (10%) | |
70+ Yrs | 1432 (14%) | 7829 (9%) | 19037 (9%) | |
Median HH Income | $81,972 | $56,328 | $57,473 | |
Total Household Income | < 24K | 374 (8%) | 7393 (20%) | 15077 (18%) |
25-49K | 821 (18%) | 8297 (23%) | 19662 (24%) | |
50-74K | 785 (18%) | 6527 (18%) | 15991 (19%) | |
75-99K | 676 (15%) | 4951 (14%) | 11100 (13%) | |
100-199K | 1395 (32%) | 6820 (19%) | 15665 (19%) | |
200K+ | 287 (6%) | 1318 (3%) | 3575 (4%) | |
Highest Education Level | No Diploma | 191 | 6304 | 14432 |
Diploma or GED | 1807 | 17471 | 41057 | |
Some College | 1276 | 10421 | 23176 | |
Assoc. Degree | 1116 | 4552 | 11085 | |
Bachelors Degree | 2306 | 13008 | 28968 | |
Higher Degree | 853 | 7331 | 16442 | |
Total Housing Units | 4,559 | 40,648 | 91,589 | |
--Owner-Occupied | 3,497 | 17,108 | 43,135 | |
--Renter-Occupied | 841 | 18,199 | 37,935 | |
Owner-Occupied Values | < 100K | 160 | 2509 | 8024 |
100-199K | 2021 | 9317 | 20639 | |
200-299K | 986 | 3498 | 8966 | |
300-399K | 234 | 1107 | 3119 | |
400-499K | 40 | 333 | 1268 | |
500K+ | 56 | 343 | 1120 | |
Total Working Age Population | 8,344 | 68,041 | 155,989 | |
In Work Force | 5,745 | 43,865 | 102,069 | |
Not In Work Force | 2,598 | 24,176 | 53,920 | |
Workforce Employed | 5,593 | 41,732 | 96,731 | |
Workforce Unemployed | 148 | 2,094 | 5,187 | |
Civlian Workforce | 5,740 | 43,826 | 101,918 | |
Military Workforce | 5 | 39 | 151 | |
Total Households | 4,337 | 35,306 | 81,070 | |
Family Households | 2,770 | 17,828 | 44,153 | |
Non-Family Households | 1,568 | 17,478 | 36,917 | |
Married Couple | 2,320 | 11,723 | 29,566 | |
Other Family | 450 | 6,105 | 14,588 | |
Married w/Child | 745 | 3,803 | 10,370 | |
Single Male w/Child | 20 | 790 | 1,966 | |
Single Female w/Child | 134 | 2,624 | 6,086 |
Population Change Last Two Decades - Plus Projection
2000 | % | 2010 | % | 2020 | % | 2030 | |
---|---|---|---|---|---|---|---|
Pennsylvania | 12,281,054 | +3 | 12,702,379 | +4 | 13,230,170 | +4 | 13,759,594 |
Cumberland County | 213,674 | +10 | 235,406 | +7 | 251,836 | +6 | 268,063 |
Dauphin County | 251,798 | +6 | 268,100 | +4 | 279,506 | +3 | 289,132 |
Juniata County | 22,821 | +8 | 24,636 | 0 | 24,681 | +1 | 25,013 |
Perry County | 43,602 | +5 | 45,969 | +6 | 48,597 | +4 | 50,348 |
York County | 381,751 | +14 | 434,972 | +6 | 460,514 | +5 | 484,497 |
Total Working Age Population:
Total Households:
Total Working Age Population:
Total Households:
Total Working Age Population:
Total Households: