Industrial Properties
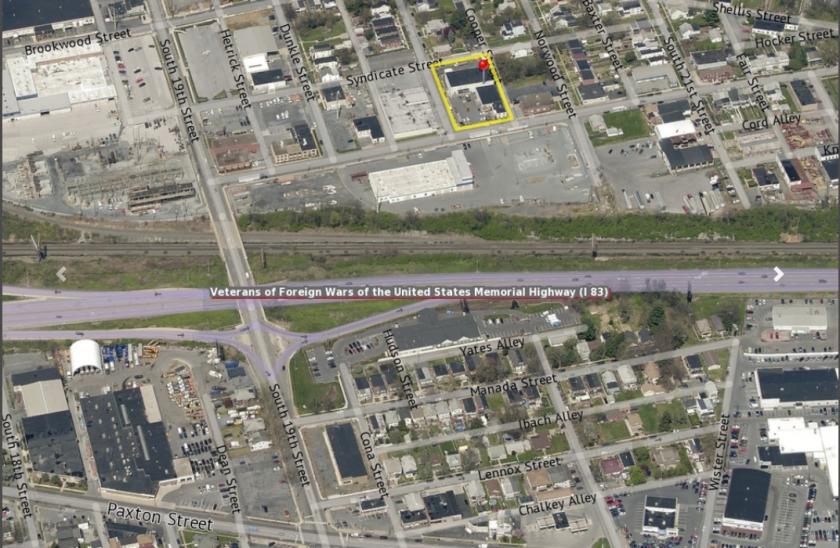
2010 Greenwood Street Harrisburg, PA 17104
2010 Greenwood Street Harrisburg, PA 17104

Details & Description
Property Highlights
• Rare userbuyer opportunity to purchase industrial facility. Transfer subject to seller relocating existing tenant
• Heavy Industrial Zoning provides flexibility for a variety of industrial uses
Listing Agents

Jason Grace
O: 717-731-1990
M: 717-421-1943
jgrace@landmarkcr.com
O: 717-731-1990
M: 717-421-1943
jgrace@landmarkcr.com

Roy Brenner
O: 717-731-1990
M: 717-512-3966
rbrenner@landmarkcr.com
O: 717-731-1990
M: 717-512-3966
rbrenner@landmarkcr.com
While we strive to provide the most accurate information, all listing information, and demographic data, is provided by third-parties. As such, MyEListing will not be responsible for the accuracy of the information. It is strongly recommended that you verify all information with the listing agent, and any relevant agencies, prior to making any decisions.