Retail Space
1 North Virginia Avenue Penns Grove, NJ 08069
1 North Virginia Avenue Penns Grove, NJ 08069
Details & Description
Property Highlights
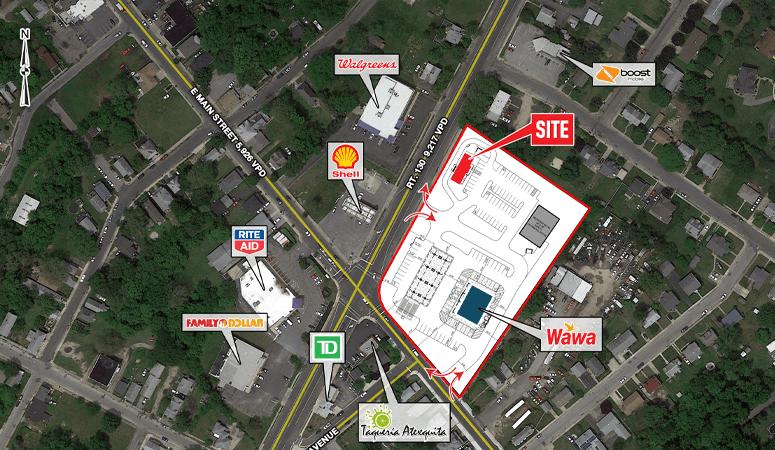
- • Join Wawa
- • Site accessible from Rt. 130 and E. Main St
- • Easy access to 295 via E. Main St.
- • Pylon signage available
- • Proposed Wawa set to open Q1 2023
Listing Agents

Shane Hart
O: 215-282-0151
M: 484-319-0744
shart@metrocommercial.com
O: 215-282-0151
M: 484-319-0744
shart@metrocommercial.com
While we strive to provide the most accurate information, all listing information, and demographic data, is provided by third-parties. As such, MyEListing will not be responsible for the accuracy of the information. It is strongly recommended that you verify all information with the listing agent, and any relevant agencies, prior to making any decisions.

