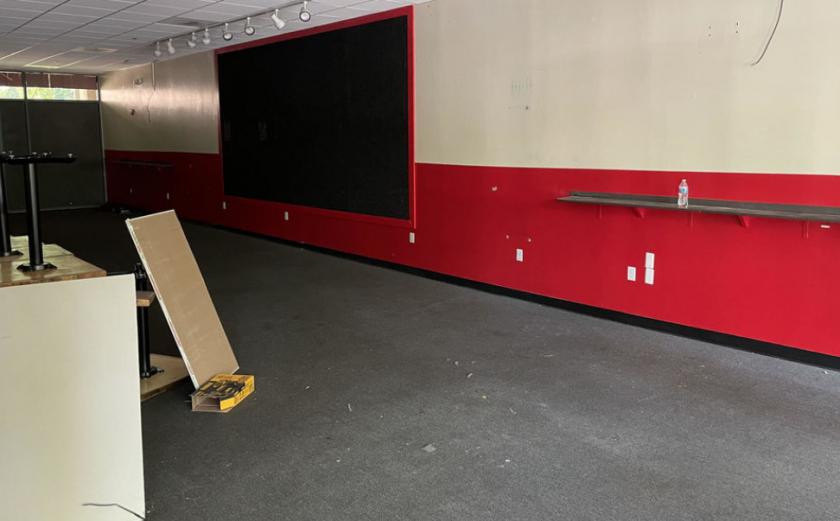
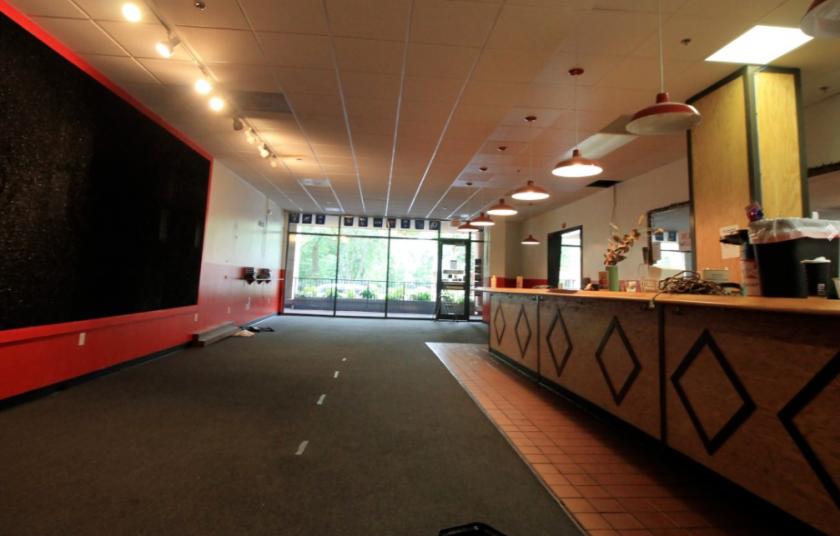
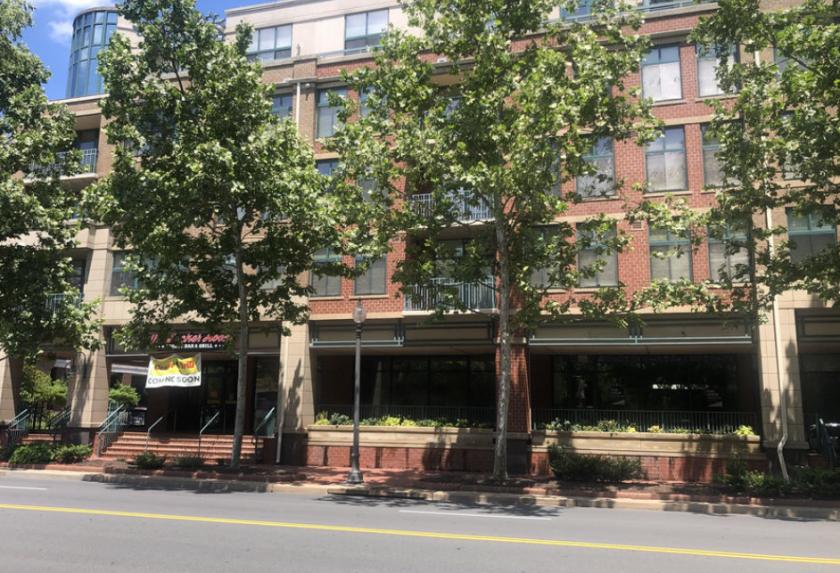
1-Mile | 3-Miles | 5-Miles | ||
---|---|---|---|---|
Total Population | 20,279 | 162,861 | 438,997 | |
Population Median Age | 38 | 38 | 38 | |
Population by Age | 0-9 Yrs | 2894 (14%) | 22524 (13%) | 56457 (12%) |
10-19 Yrs | 2598 (12%) | 18701 (11%) | 47809 (10%) | |
20-29 Yrs | 2230 (10%) | 19547 (12%) | 63143 (14%) | |
30-39 Yrs | 2776 (13%) | 26192 (16%) | 73024 (16%) | |
40-49 Yrs | 3148 (15%) | 24319 (14%) | 61843 (14%) | |
50-59 Yrs | 2860 (14%) | 21019 (12%) | 54591 (12%) | |
60-69 Yrs | 2271 (11%) | 16931 (10%) | 44033 (10%) | |
70+ Yrs | 1501 (7%) | 13627 (8%) | 38097 (8%) | |
Median HH Income | $142,258 | $131,410 | $120,194 | |
Total Household Income | < 24K | 504 (6%) | 4378 (7%) | 15525 (9%) |
25-49K | 580 (7%) | 5869 (9%) | 17242 (10%) | |
50-74K | 619 (8%) | 5996 (10%) | 18898 (11%) | |
75-99K | 773 (10%) | 6309 (10%) | 19121 (11%) | |
100-199K | 2608 (34%) | 19330 (32%) | 53597 (31%) | |
200K+ | 2387 (31%) | 17485 (29%) | 44538 (26%) | |
Highest Education Level | No Diploma | 490 | 9475 | 26472 |
Diploma or GED | 1301 | 12400 | 33357 | |
Some College | 1501 | 10927 | 31052 | |
Assoc. Degree | 603 | 4856 | 13126 | |
Bachelors Degree | 4345 | 35050 | 96331 | |
Higher Degree | 5560 | 40795 | 108904 | |
Total Housing Units | 7,826 | 62,531 | 178,254 | |
--Owner-Occupied | 4,926 | 38,180 | 94,187 | |
--Renter-Occupied | 2,543 | 21,186 | 74,735 | |
Owner-Occupied Values | < 100K | 10 | 223 | 660 |
100-199K | 124 | 1333 | 3433 | |
200-299K | 205 | 1829 | 5712 | |
300-399K | 220 | 1938 | 6548 | |
400-499K | 432 | 3572 | 10286 | |
500K+ | 3936 | 29285 | 67547 | |
Total Working Age Population | 15,712 | 128,367 | 352,278 | |
In Work Force | 11,802 | 93,804 | 257,741 | |
Not In Work Force | 3,910 | 34,563 | 94,537 | |
Workforce Employed | 11,314 | 90,131 | 247,384 | |
Workforce Unemployed | 398 | 3,016 | 8,313 | |
Civlian Workforce | 11,711 | 93,147 | 255,697 | |
Military Workforce | 91 | 657 | 2,044 | |
Total Households | 7,469 | 59,366 | 168,922 | |
Family Households | 5,222 | 40,506 | 102,868 | |
Non-Family Households | 2,247 | 18,860 | 66,054 | |
Married Couple | 4,080 | 33,010 | 82,118 | |
Other Family | 1,143 | 7,496 | 20,750 | |
Married w/Child | 2,141 | 16,661 | 39,862 | |
Single Male w/Child | 123 | 1,055 | 2,494 | |
Single Female w/Child | 598 | 2,374 | 7,331 |
Population Change Last Two Decades - Plus Projection
2000 | % | 2010 | % | 2020 | % | 2030 | |
---|---|---|---|---|---|---|---|
District of Columbia | 572,059 | +5 | 601,723 | +21 | 729,501 | +15 | 842,154 |
Maryland | 5,296,486 | +9 | 5,773,552 | +6 | 6,141,900 | +6 | 6,518,750 |
Montgomery County | 873,341 | +11 | 971,777 | +8 | 1,052,050 | +7 | 1,128,800 |
Prince Georges County | 801,515 | +8 | 863,420 | +6 | 916,150 | +4 | 952,950 |
Virginia | 7,078,515 | +13 | 8,001,024 | +8 | 8,655,021 | +8 | 9,331,666 |
Arlington County | 189,453 | +10 | 207,627 | +20 | 249,298 | +10 | 274,339 |
Fairfax County | 969,749 | +12 | 1,081,726 | +7 | 1,162,504 | +7 | 1,244,025 |
Prince William County | 280,813 | +43 | 402,002 | +19 | 478,134 | +20 | 571,844 |
Alexandria city | 128,283 | +9 | 139,966 | +19 | 166,261 | +10 | 182,067 |
Falls Church city | 10,377 | +19 | 12,332 | +22 | 14,988 | +14 | 17,032 |
Total Working Age Population:
Total Households:
Total Working Age Population:
Total Households:
Total Working Age Population:
Total Households: