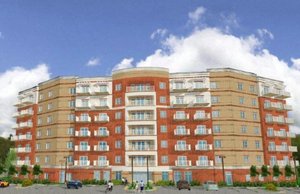
1-Mile | 3-Miles | 5-Miles | ||
---|---|---|---|---|
Total Population | 17,650 | 87,177 | 177,658 | |
Population Median Age | 32 | 33 | 34 | |
Population by Age | 0-9 Yrs | 3173 (17%) | 14988 (17%) | 27909 (15%) |
10-19 Yrs | 1988 (11%) | 11219 (12%) | 26050 (14%) | |
20-29 Yrs | 3017 (17%) | 14128 (16%) | 24659 (13%) | |
30-39 Yrs | 3318 (18%) | 14662 (16%) | 27656 (15%) | |
40-49 Yrs | 2500 (14%) | 11805 (13%) | 26602 (14%) | |
50-59 Yrs | 1760 (9%) | 10011 (11%) | 22470 (12%) | |
60-69 Yrs | 982 (5%) | 6002 (6%) | 13011 (7%) | |
70+ Yrs | 911 (5%) | 4363 (5%) | 9301 (5%) | |
Median HH Income | $63,244 | $81,606 | $95,968 | |
Total Household Income | < 24K | 921 (16%) | 2763 (10%) | 4899 (9%) |
25-49K | 1455 (25%) | 4482 (17%) | 7483 (14%) | |
50-74K | 1005 (17%) | 4443 (17%) | 7919 (14%) | |
75-99K | 720 (12%) | 4071 (15%) | 7341 (13%) | |
100-199K | 1248 (21%) | 7259 (28%) | 17610 (33%) | |
200K+ | 372 (6%) | 2510 (9%) | 7665 (14%) | |
Highest Education Level | No Diploma | 2428 | 10521 | 16685 |
Diploma or GED | 3243 | 14736 | 25693 | |
Some College | 2135 | 9834 | 19239 | |
Assoc. Degree | 537 | 3855 | 8500 | |
Bachelors Degree | 2170 | 10469 | 26393 | |
Higher Degree | 856 | 5306 | 15610 | |
Total Housing Units | 6,101 | 26,768 | 55,279 | |
--Owner-Occupied | 2,035 | 14,786 | 35,230 | |
--Renter-Occupied | 3,685 | 10,742 | 17,688 | |
Owner-Occupied Values | < 100K | 27 | 331 | 777 |
100-199K | 505 | 1881 | 2656 | |
200-299K | 775 | 4580 | 7276 | |
300-399K | 623 | 5049 | 10451 | |
400-499K | 76 | 2038 | 8035 | |
500K+ | 29 | 907 | 6034 | |
Total Working Age Population | 13,151 | 65,293 | 133,580 | |
In Work Force | 10,027 | 49,333 | 99,902 | |
Not In Work Force | 3,124 | 15,960 | 33,678 | |
Workforce Employed | 9,643 | 47,012 | 95,421 | |
Workforce Unemployed | 384 | 2,224 | 4,174 | |
Civlian Workforce | 10,027 | 49,236 | 99,595 | |
Military Workforce | 0 | 97 | 307 | |
Total Households | 5,720 | 25,528 | 52,918 | |
Family Households | 3,689 | 19,129 | 40,514 | |
Non-Family Households | 2,031 | 6,399 | 12,404 | |
Married Couple | 2,531 | 14,063 | 31,414 | |
Other Family | 1,159 | 5,066 | 9,100 | |
Married w/Child | 1,509 | 7,926 | 17,069 | |
Single Male w/Child | 159 | 872 | 1,593 | |
Single Female w/Child | 408 | 1,911 | 3,671 |
Population Change Last Two Decades - Plus Projection
2000 | % | 2010 | % | 2020 | % | 2030 | |
---|---|---|---|---|---|---|---|
Virginia | 7,078,515 | +13 | 8,001,024 | +8 | 8,655,021 | +8 | 9,331,666 |
Fairfax County | 969,749 | +12 | 1,081,726 | +7 | 1,162,504 | +7 | 1,244,025 |
Fauquier County | 55,139 | +18 | 65,203 | +9 | 71,395 | +10 | 78,698 |
Loudoun County | 169,599 | +84 | 312,311 | +38 | 430,584 | +29 | 554,808 |
Prince William County | 280,813 | +43 | 402,002 | +19 | 478,134 | +20 | 571,844 |
Manassas city | 35,135 | +8 | 37,821 | +14 | 43,099 | +8 | 46,332 |
Manassas Park city | 10,290 | +39 | 14,273 | +20 | 17,086 | +19 | 20,284 |
Total Working Age Population:
Total Households:
Total Working Age Population:
Total Households:
Total Working Age Population:
Total Households: