Commercial Land
Factory Rd US-35 Beavercreek, OH 45434
Factory Rd US-35 Beavercreek, OH 45434
Details & Description
Property Highlights
- • High growth corridor.
- • Over 45,000 cars per day
- • Beavercreek, OH population, 46,086
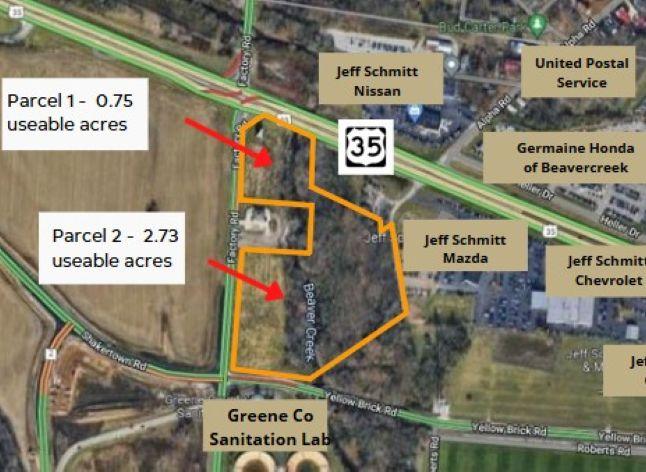
- • Parcel 1 5.86 acres, $2,047,500
- • Parcel 2 2.66 acres, $750,000
Listing Agents

Timothy Albro
O: 937-222-1600
M: 937-609-8071
talbro@crestrealtyohio.com
O: 937-222-1600
M: 937-609-8071
talbro@crestrealtyohio.com
While we strive to provide the most accurate information, all listing information, and demographic data, is provided by third-parties. As such, MyEListing will not be responsible for the accuracy of the information. It is strongly recommended that you verify all information with the listing agent, and any relevant agencies, prior to making any decisions.


