Commercial Land
Lindenwood - Gray Dr Mechanicsburg, PA 17055
Lindenwood - Gray Dr Mechanicsburg, PA 17055
Details & Description
Property Highlights
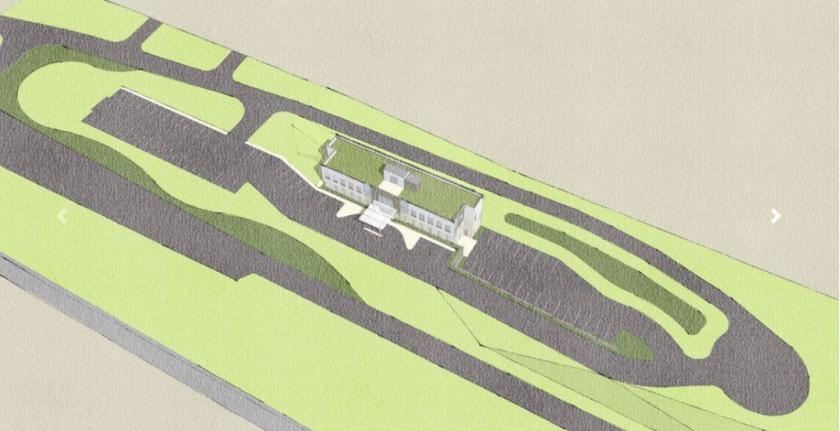
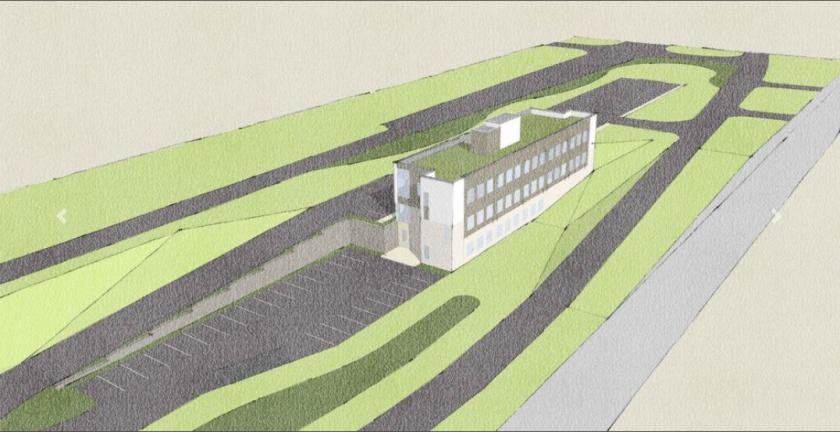
• Rare opportunity to lease or purchase a new turn-key administrative office or clinical medical facility
• Well located between Carlisle Hospital UPMC, Hampden Hospital PSH West Shore Hospital UPMC
Listing Agents

Jason Grace
O: 717-731-1990
M: 717-421-1943
jgrace@landmarkcr.com
O: 717-731-1990
M: 717-421-1943
jgrace@landmarkcr.com

Michael Curran
O: 717-731-1990
M: 717-805-9277
mcurran@landmarkcr.com
O: 717-731-1990
M: 717-805-9277
mcurran@landmarkcr.com
While we strive to provide the most accurate information, all listing information, and demographic data, is provided by third-parties. As such, MyEListing will not be responsible for the accuracy of the information. It is strongly recommended that you verify all information with the listing agent, and any relevant agencies, prior to making any decisions.