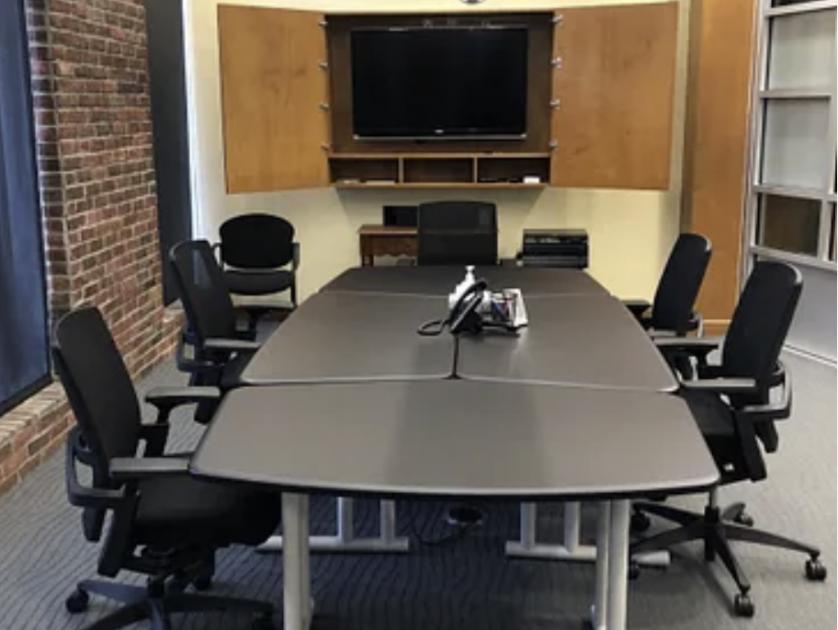
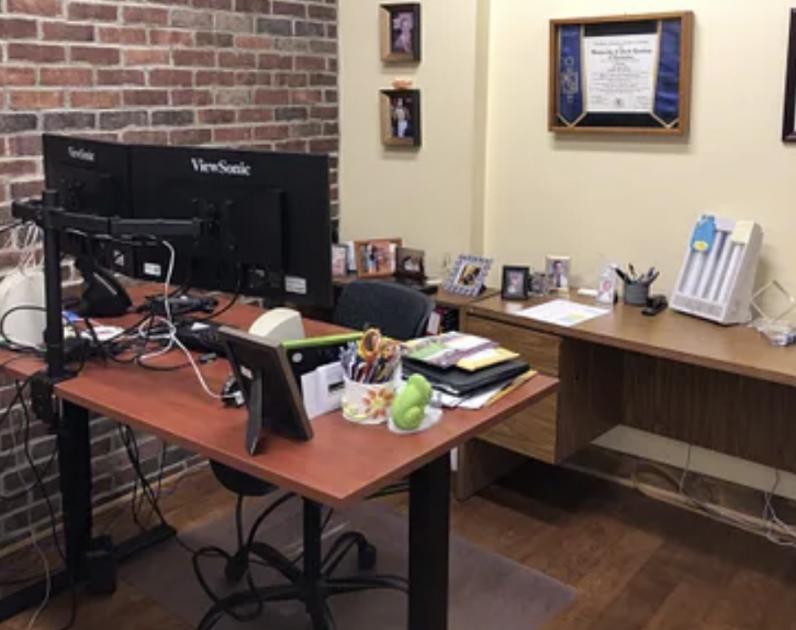
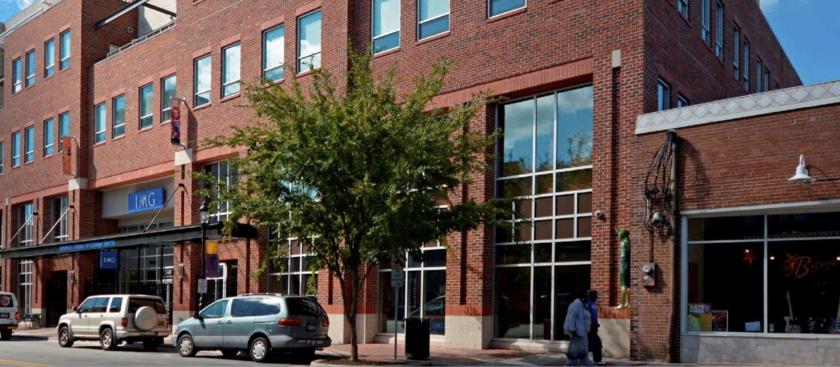
1-Mile | 3-Miles | 5-Miles | ||
---|---|---|---|---|
Total Population | 11,380 | 69,684 | 157,439 | |
Population Median Age | 35 | 36 | 36 | |
Population by Age | 0-9 Yrs | 1377 (12%) | 9117 (13%) | 21465 (13%) |
10-19 Yrs | 1277 (11%) | 11302 (16%) | 22753 (14%) | |
20-29 Yrs | 2767 (24%) | 12325 (17%) | 26437 (16%) | |
30-39 Yrs | 1769 (15%) | 8775 (12%) | 20108 (12%) | |
40-49 Yrs | 1089 (9%) | 7290 (10%) | 17169 (10%) | |
50-59 Yrs | 1433 (12%) | 8397 (12%) | 19264 (12%) | |
60-69 Yrs | 847 (7%) | 6621 (9%) | 15580 (9%) | |
70+ Yrs | 820 (7%) | 5857 (8%) | 14663 (9%) | |
Median HH Income | $33,604 | $34,332 | $38,932 | |
Total Household Income | < 24K | 1931 (39%) | 10354 (39%) | 20639 (33%) |
25-49K | 1153 (23%) | 6175 (23%) | 16332 (26%) | |
50-74K | 804 (16%) | 3647 (13%) | 9771 (15%) | |
75-99K | 183 (3%) | 1711 (6%) | 5280 (8%) | |
100-199K | 561 (11%) | 3023 (11%) | 6794 (11%) | |
200K+ | 235 (4%) | 1557 (5%) | 2829 (4%) | |
Highest Education Level | No Diploma | 1019 | 6290 | 13495 |
Diploma or GED | 1998 | 11386 | 26053 | |
Some College | 1301 | 8483 | 20884 | |
Assoc. Degree | 370 | 2353 | 6724 | |
Bachelors Degree | 1606 | 7682 | 18876 | |
Higher Degree | 1192 | 6591 | 13261 | |
Total Housing Units | 5,867 | 31,810 | 71,727 | |
--Owner-Occupied | 993 | 10,865 | 28,683 | |
--Renter-Occupied | 3,874 | 15,601 | 32,963 | |
Owner-Occupied Values | < 100K | 292 | 3773 | 9740 |
100-199K | 199 | 3011 | 10776 | |
200-299K | 159 | 1545 | 3511 | |
300-399K | 141 | 779 | 1785 | |
400-499K | 127 | 471 | 896 | |
500K+ | 74 | 1286 | 1973 | |
Total Working Age Population | 9,546 | 55,749 | 124,308 | |
In Work Force | 5,125 | 30,070 | 71,691 | |
Not In Work Force | 4,421 | 25,679 | 52,617 | |
Workforce Employed | 4,712 | 27,602 | 66,698 | |
Workforce Unemployed | 411 | 2,406 | 4,802 | |
Civlian Workforce | 5,123 | 30,008 | 71,500 | |
Military Workforce | 2 | 62 | 191 | |
Total Households | 4,867 | 26,466 | 61,645 | |
Family Households | 1,708 | 13,607 | 33,474 | |
Non-Family Households | 3,159 | 12,859 | 28,171 | |
Married Couple | 857 | 7,599 | 19,991 | |
Other Family | 851 | 6,008 | 13,483 | |
Married w/Child | 297 | 2,990 | 7,660 | |
Single Male w/Child | 107 | 685 | 1,651 | |
Single Female w/Child | 407 | 2,790 | 6,083 |
Population Change Last Two Decades - Plus Projection
2000 | % | 2010 | % | 2020 | % | 2030 | |
---|---|---|---|---|---|---|---|
North Carolina | 8,049,313 | +18 | 9,535,483 | +11 | 10,630,691 | +11 | 11,836,070 |
Forsyth County | 306,067 | +15 | 350,670 | +9 | 383,123 | +9 | 418,257 |
Total Working Age Population:
Total Households:
Total Working Age Population:
Total Households:
Total Working Age Population:
Total Households: