Specialty Real Estate
2232 West Campbell Avenue Phoenix, AZ 85015
2232 West Campbell Avenue Phoenix, AZ 85015
Details & Description
Property Highlights
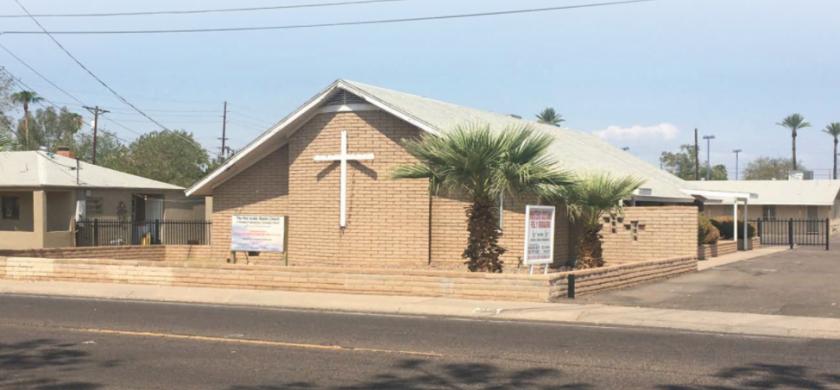
- • BLOCK CONSTRUCTION
- • SEATS 100
- • SANCTUARY HAS 2 OFFICES, RESTROOMS, LOBBY
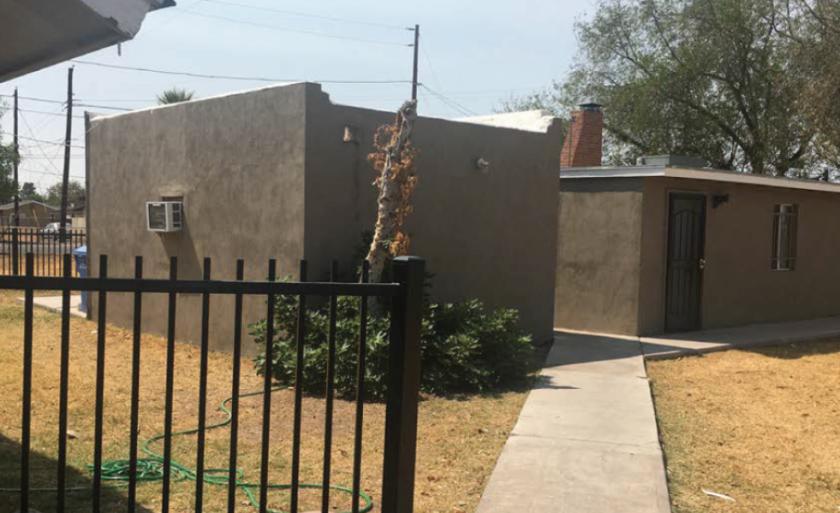
- • BLOCK WALL AND GATED PARKING
- • MULTIPLE CLASSROOM BUILDINGS
Listing Agents

Aaron Norwood
O: 480-294-6016
M: 480-510-1353
anorwood@levrose.com
O: 480-294-6016
M: 480-510-1353
anorwood@levrose.com
While we strive to provide the most accurate information, all listing information, and demographic data, is provided by third-parties. As such, MyEListing will not be responsible for the accuracy of the information. It is strongly recommended that you verify all information with the listing agent, and any relevant agencies, prior to making any decisions.