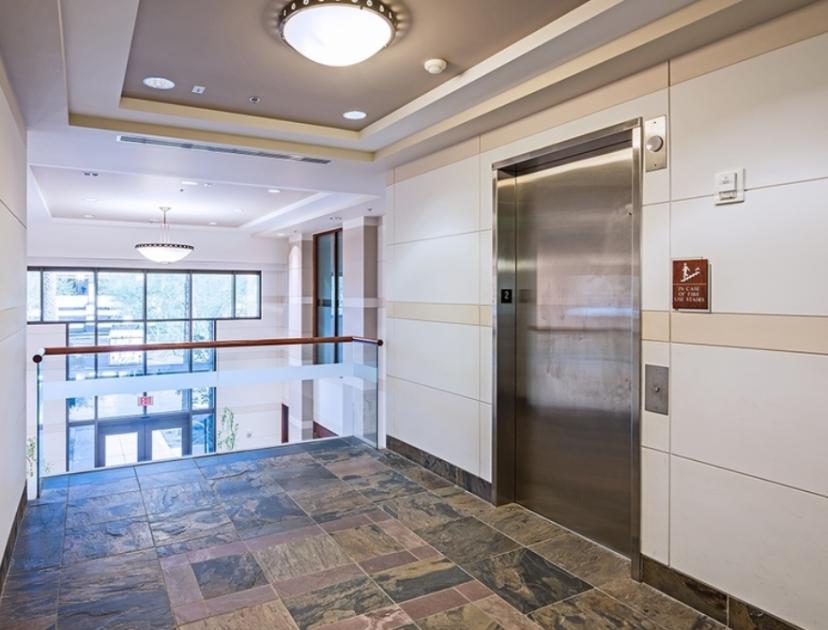
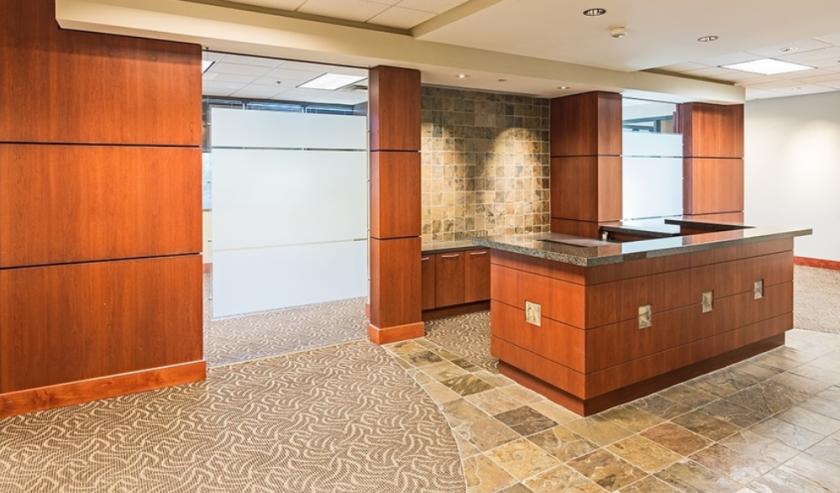
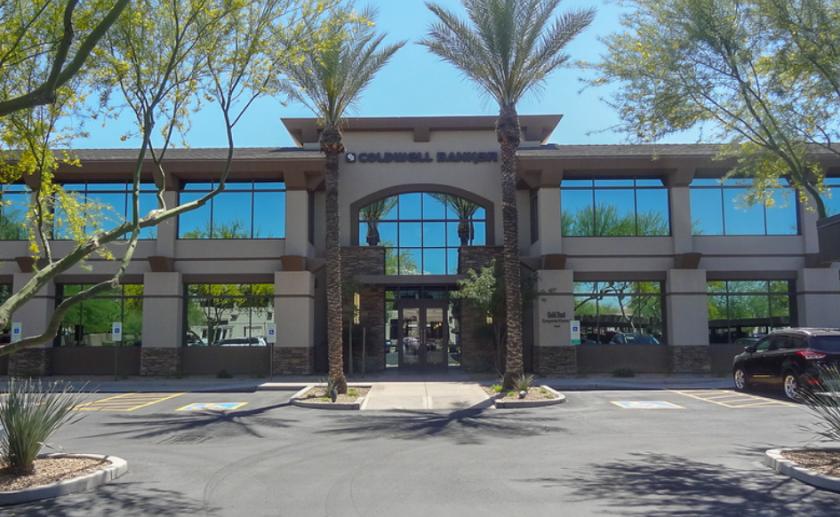
1-Mile | 3-Miles | 5-Miles | ||
---|---|---|---|---|
Total Population | 6,906 | 59,570 | 180,991 | |
Population Median Age | 47 | 47 | 45 | |
Population by Age | 0-9 Yrs | 429 (6%) | 4563 (7%) | 16404 (9%) |
10-19 Yrs | 711 (10%) | 6236 (10%) | 17863 (9%) | |
20-29 Yrs | 922 (13%) | 5325 (8%) | 18893 (10%) | |
30-39 Yrs | 705 (10%) | 5610 (9%) | 20961 (11%) | |
40-49 Yrs | 734 (10%) | 7324 (12%) | 22694 (12%) | |
50-59 Yrs | 942 (13%) | 9169 (15%) | 27499 (15%) | |
60-69 Yrs | 1075 (15%) | 9397 (15%) | 26490 (14%) | |
70+ Yrs | 1387 (20%) | 11945 (20%) | 30189 (16%) | |
Median HH Income | $87,515 | $97,664 | $89,237 | |
Total Household Income | < 24K | 457 (14%) | 3155 (12%) | 9354 (11%) |
25-49K | 579 (17%) | 3835 (14%) | 12548 (15%) | |
50-74K | 433 (13%) | 3526 (13%) | 11907 (14%) | |
75-99K | 319 (9%) | 2888 (10%) | 10965 (13%) | |
100-199K | 780 (23%) | 7483 (28%) | 21661 (27%) | |
200K+ | 691 (21%) | 5382 (20%) | 13674 (17%) | |
Highest Education Level | No Diploma | 118 | 1161 | 4123 |
Diploma or GED | 642 | 5909 | 18101 | |
Some College | 960 | 8455 | 27761 | |
Assoc. Degree | 426 | 3422 | 10131 | |
Bachelors Degree | 1794 | 15600 | 46418 | |
Higher Degree | 1408 | 11610 | 32106 | |
Total Housing Units | 4,175 | 31,746 | 93,379 | |
--Owner-Occupied | 2,050 | 19,415 | 55,145 | |
--Renter-Occupied | 1,209 | 6,854 | 24,964 | |
Owner-Occupied Values | < 100K | 13 | 204 | 896 |
100-199K | 124 | 924 | 3651 | |
200-299K | 109 | 1747 | 6774 | |
300-399K | 156 | 2680 | 11277 | |
400-499K | 326 | 3451 | 10614 | |
500K+ | 1321 | 10409 | 21934 | |
Total Working Age Population | 6,020 | 50,897 | 153,433 | |
In Work Force | 3,643 | 29,998 | 97,280 | |
Not In Work Force | 2,377 | 20,900 | 56,153 | |
Workforce Employed | 3,556 | 28,899 | 93,789 | |
Workforce Unemployed | 86 | 1,088 | 3,417 | |
Civlian Workforce | 3,643 | 29,987 | 97,205 | |
Military Workforce | 0 | 11 | 75 | |
Total Households | 3,260 | 26,269 | 80,108 | |
Family Households | 1,804 | 15,776 | 46,859 | |
Non-Family Households | 1,456 | 10,493 | 33,249 | |
Married Couple | 1,513 | 13,367 | 38,374 | |
Other Family | 290 | 2,409 | 8,485 | |
Married w/Child | 399 | 3,997 | 12,225 | |
Single Male w/Child | 47 | 369 | 1,150 | |
Single Female w/Child | 103 | 757 | 2,758 |
Population Change Last Two Decades - Plus Projection
2000 | % | 2010 | % | 2020 | % | 2030 | |
---|---|---|---|---|---|---|---|
Arizona | 5,130,632 | +25 | 6,392,017 | +14 | 7,286,100 | +14 | 8,284,900 |
Maricopa County | 3,072,149 | +24 | 3,817,117 | +16 | 4,436,900 | +15 | 5,107,700 |
Total Working Age Population:
Total Households:
Total Working Age Population:
Total Households:
Total Working Age Population:
Total Households: