Specialty Real Estate
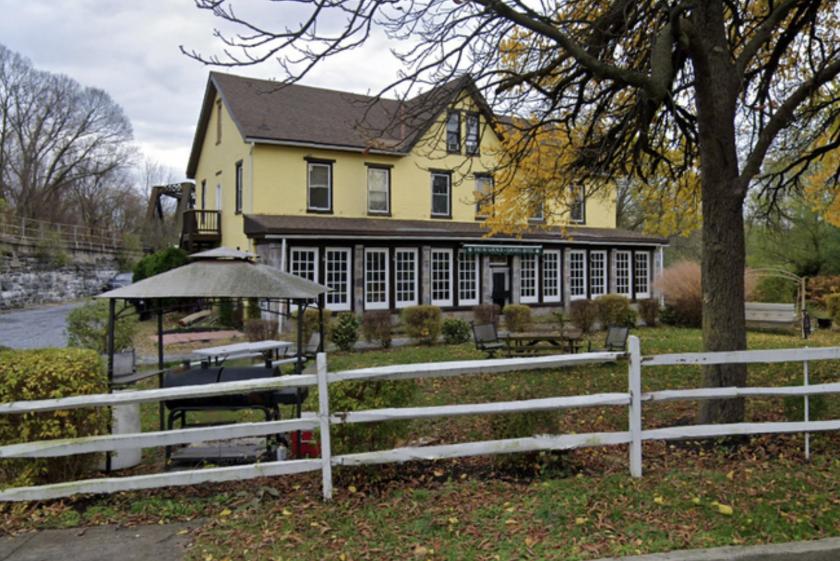
900 Shanois Street Harrisburg, PA 17104
900 Shanois Street Harrisburg, PA 17104
Details & Description
Property Highlights
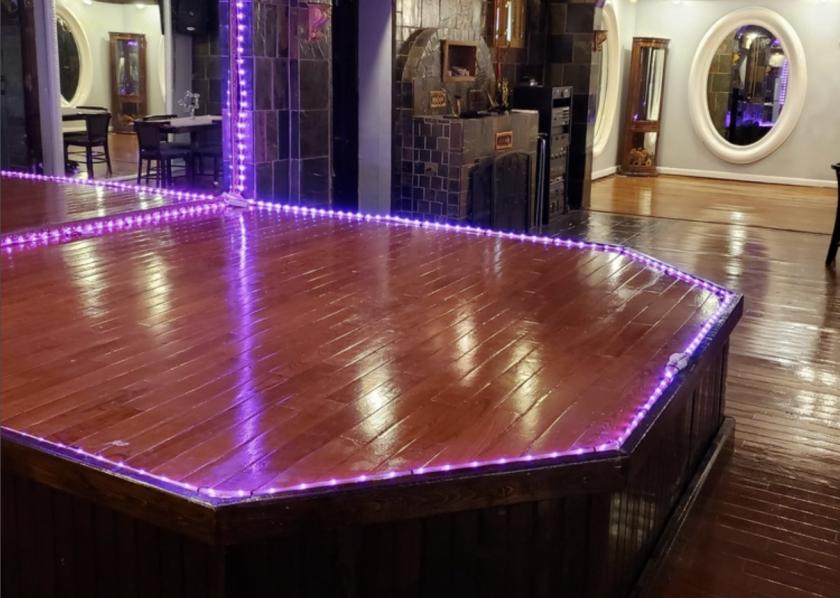
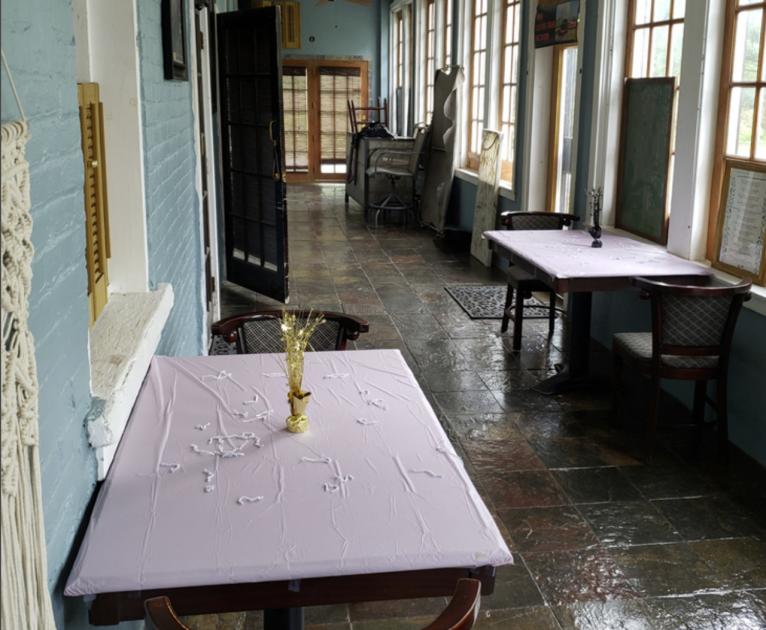
• One of a kind investment. Built in 1870. Own a piece of Harrisburg history.
• 12 rooms fully rented - excellent income High CAP rate
Listing Agents

Seymour Barget
O: 717-731-1990
M: 717-623-2007
sbarget@landmarkcr.com
O: 717-731-1990
M: 717-623-2007
sbarget@landmarkcr.com
While we strive to provide the most accurate information, all listing information, and demographic data, is provided by third-parties. As such, MyEListing will not be responsible for the accuracy of the information. It is strongly recommended that you verify all information with the listing agent, and any relevant agencies, prior to making any decisions.