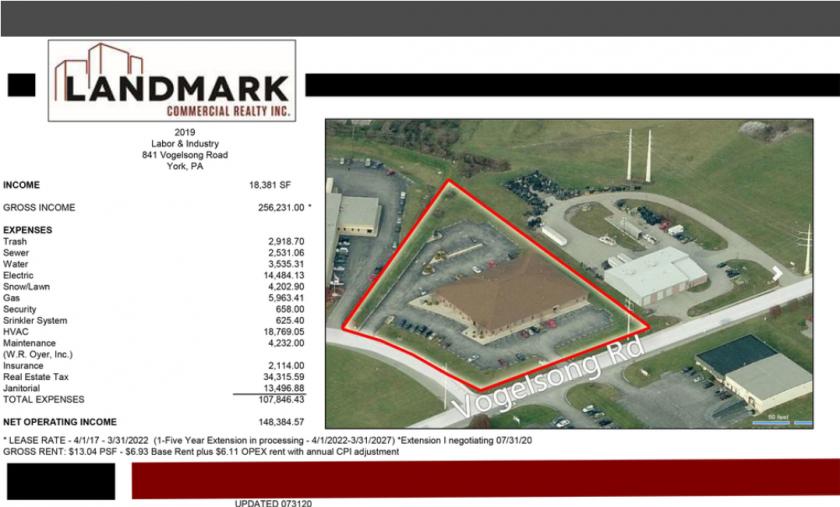
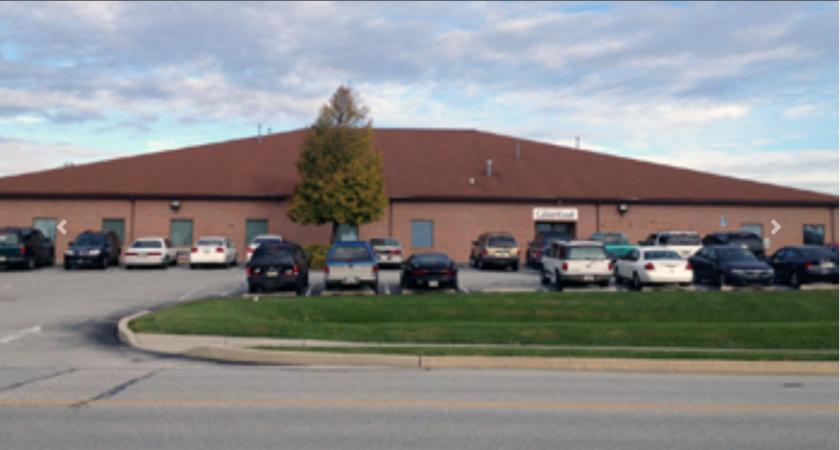
1-Mile | 3-Miles | 5-Miles | ||
---|---|---|---|---|
Total Population | 6,671 | 83,093 | 139,801 | |
Population Median Age | 42 | 37 | 38 | |
Population by Age | 0-9 Yrs | 603 (9%) | 11160 (13%) | 17363 (12%) |
10-19 Yrs | 892 (13%) | 12103 (14%) | 19669 (14%) | |
20-29 Yrs | 900 (13%) | 12027 (14%) | 19162 (13%) | |
30-39 Yrs | 781 (11%) | 10774 (12%) | 17883 (12%) | |
40-49 Yrs | 988 (14%) | 10807 (13%) | 17769 (12%) | |
50-59 Yrs | 823 (12%) | 10408 (12%) | 18253 (13%) | |
60-69 Yrs | 614 (9%) | 8156 (9%) | 15119 (10%) | |
70+ Yrs | 1070 (16%) | 7658 (9%) | 14585 (10%) | |
Median HH Income | $54,163 | $47,178 | $55,394 | |
Total Household Income | < 24K | 625 (21%) | 8432 (26%) | 11592 (21%) |
25-49K | 698 (24%) | 8330 (26%) | 12817 (23%) | |
50-74K | 563 (19%) | 5939 (18%) | 10391 (19%) | |
75-99K | 408 (14%) | 3382 (10%) | 6761 (12%) | |
100-199K | 519 (18%) | 4954 (15%) | 10348 (19%) | |
200K+ | 31 (1%) | 865 (2%) | 1982 (3%) | |
Highest Education Level | No Diploma | 610 | 8307 | 11789 |
Diploma or GED | 1846 | 21513 | 35949 | |
Some College | 595 | 7739 | 14220 | |
Assoc. Degree | 537 | 5203 | 9111 | |
Bachelors Degree | 655 | 6555 | 13433 | |
Higher Degree | 412 | 3933 | 8226 | |
Total Housing Units | 3,173 | 35,338 | 58,334 | |
--Owner-Occupied | 1,857 | 17,666 | 34,998 | |
--Renter-Occupied | 988 | 14,236 | 18,893 | |
Owner-Occupied Values | < 100K | 737 | 5862 | 8009 |
100-199K | 769 | 7565 | 16929 | |
200-299K | 266 | 2621 | 6568 | |
300-399K | 54 | 948 | 2047 | |
400-499K | 25 | 363 | 692 | |
500K+ | 6 | 308 | 753 | |
Total Working Age Population | 5,608 | 65,139 | 111,726 | |
In Work Force | 3,510 | 41,668 | 71,898 | |
Not In Work Force | 2,098 | 23,470 | 39,828 | |
Workforce Employed | 3,238 | 38,325 | 67,383 | |
Workforce Unemployed | 271 | 3,311 | 4,426 | |
Civlian Workforce | 3,510 | 41,636 | 71,809 | |
Military Workforce | 0 | 32 | 89 | |
Total Households | 2,845 | 31,902 | 53,891 | |
Family Households | 1,557 | 19,395 | 33,894 | |
Non-Family Households | 1,288 | 12,507 | 19,997 | |
Married Couple | 1,092 | 11,716 | 23,133 | |
Other Family | 464 | 7,679 | 10,761 | |
Married w/Child | 466 | 4,667 | 8,854 | |
Single Male w/Child | 69 | 976 | 1,379 | |
Single Female w/Child | 169 | 3,709 | 4,996 |
Population Change Last Two Decades - Plus Projection
2000 | % | 2010 | % | 2020 | % | 2030 | |
---|---|---|---|---|---|---|---|
Pennsylvania | 12,281,054 | +3 | 12,702,379 | +4 | 13,230,170 | +4 | 13,759,594 |
Lancaster County | 470,658 | +10 | 519,445 | +8 | 559,247 | +8 | 602,153 |
York County | 381,751 | +14 | 434,972 | +6 | 460,514 | +5 | 484,497 |
Total Working Age Population:
Total Households:
Total Working Age Population:
Total Households:
Total Working Age Population:
Total Households: