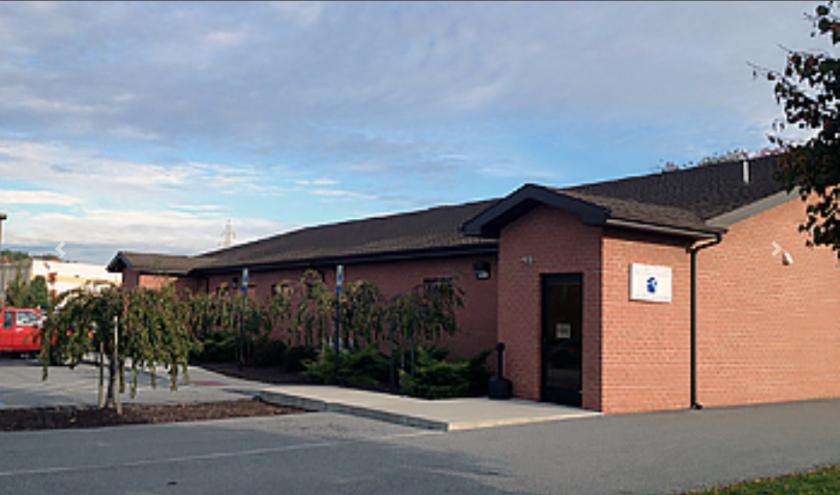
Office Space
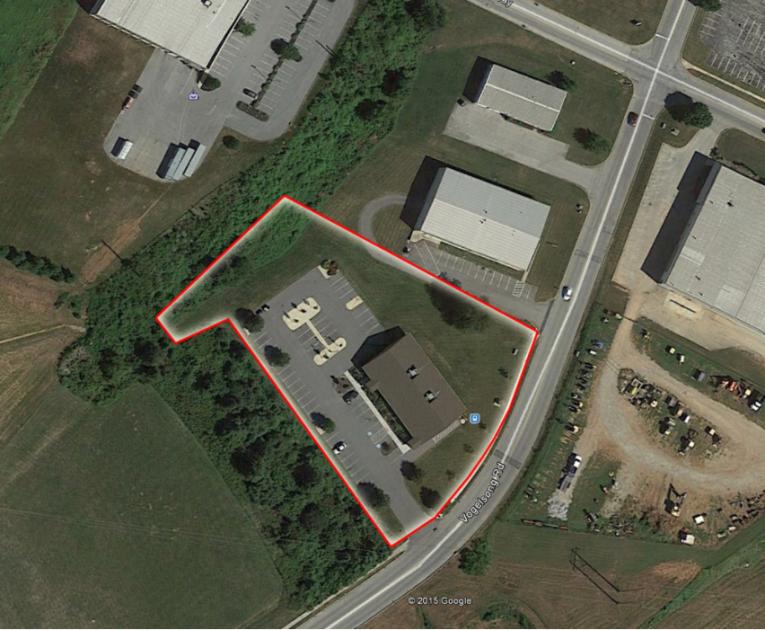
785 Vogelsong Road York, PA 17404
785 Vogelsong Road York, PA 17404
Details & Description
Property Highlights
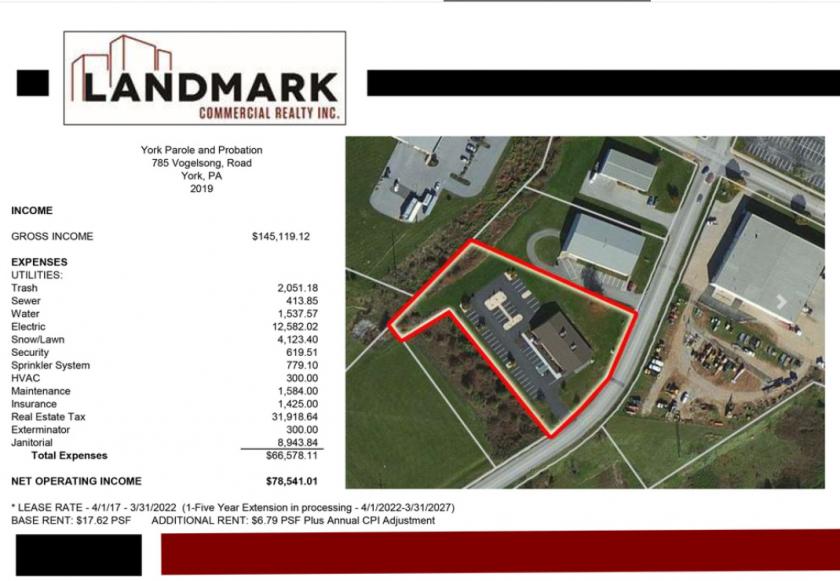
• Well situated State leased office facility with 6- years remaining on current lease term
• Currently leased to Probation and Parole with their current term expiring April of 2026
Listing Agents

David Remmel
O: 717-731-1990
M: 717-514-9469
djremmel@landmarkcr.com
O: 717-731-1990
M: 717-514-9469
djremmel@landmarkcr.com

Chuck Heller
O: 717-731-1990
cheller@landmarkcr.com
O: 717-731-1990
cheller@landmarkcr.com
While we strive to provide the most accurate information, all listing information, and demographic data, is provided by third-parties. As such, MyEListing will not be responsible for the accuracy of the information. It is strongly recommended that you verify all information with the listing agent, and any relevant agencies, prior to making any decisions.