Office Space
7201 East Camelback Road Scottsdale, AZ 85251
7201 East Camelback Road Scottsdale, AZ 85251
Details & Description
Property Highlights
- • Total Building Size is 67,691 RSF.
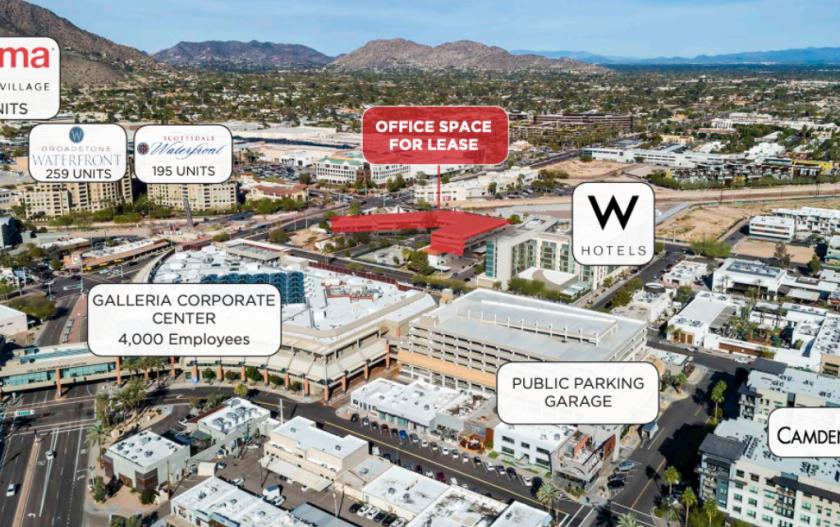
- • The heart of Old Town Scottsdale
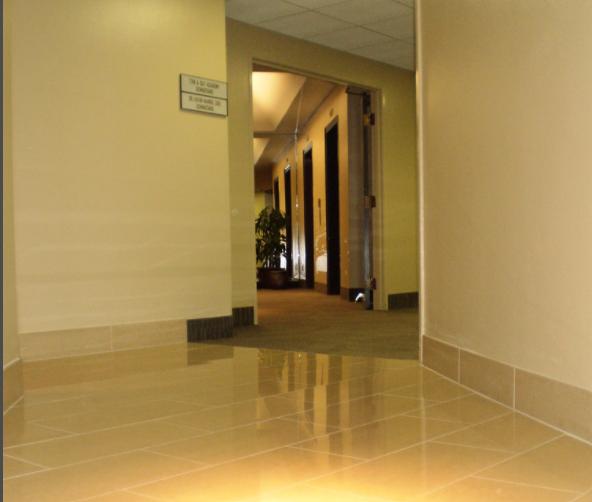
- • Interior common area recently renovated
- • 41,000 Abundant surface and
- • Covered parking
Listing Agents

Jason Reddington
O: 480-289-4504
M: 812-499-7322
jreddington@levrose.com
O: 480-289-4504
M: 812-499-7322
jreddington@levrose.com
While we strive to provide the most accurate information, all listing information, and demographic data, is provided by third-parties. As such, MyEListing will not be responsible for the accuracy of the information. It is strongly recommended that you verify all information with the listing agent, and any relevant agencies, prior to making any decisions.