Industrial Properties
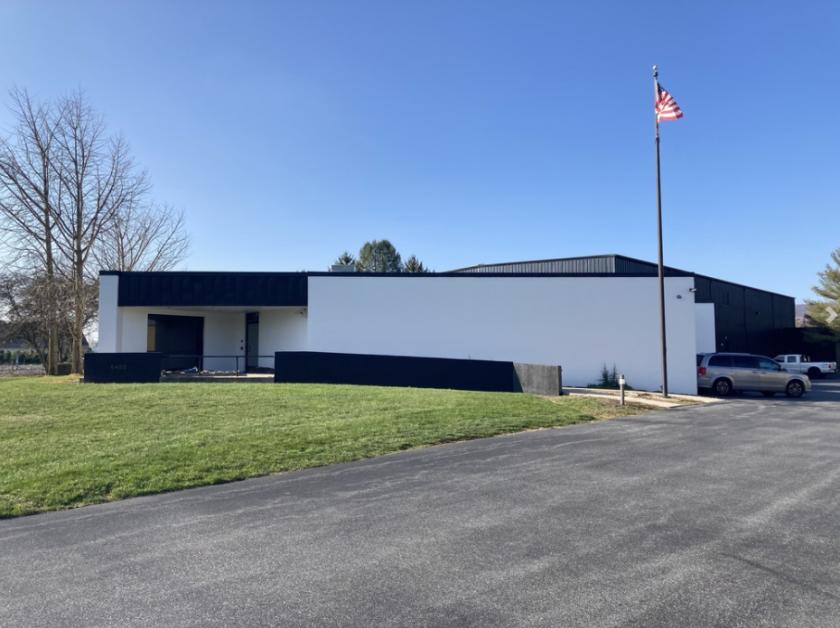
5480 Linglestown Road Harrisburg, PA 17112
5480 Linglestown Road Harrisburg, PA 17112
Details & Description
Property Highlights
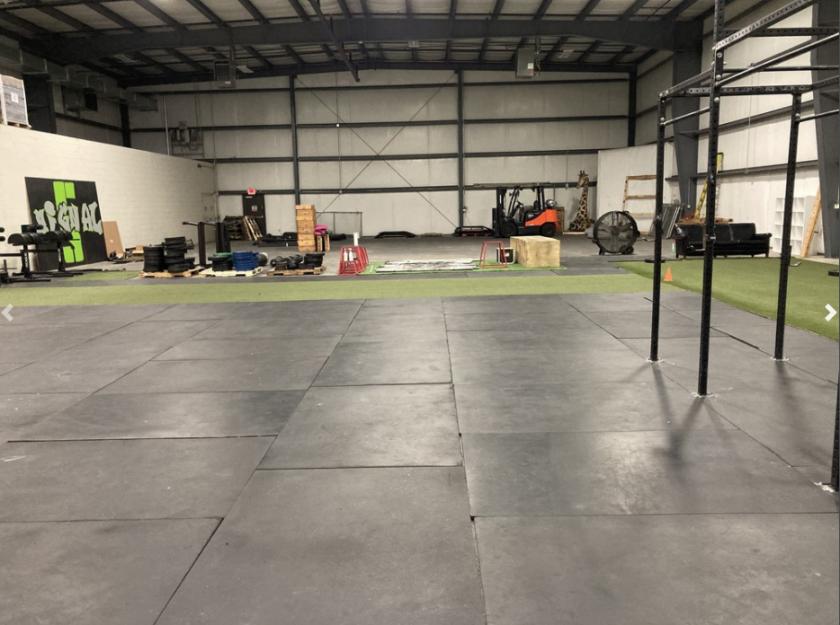
- • Two docks one drive-in door to an internal dock
- • Approximately 30 parking spaces
- • Plentiful officeadmin space
Listing Agents

Chuck Heller
O: 717-731-1990
cheller@landmarkcr.com
O: 717-731-1990
cheller@landmarkcr.com

Nick Sallack
O: 717-731-1990
M: 717-829-4011
nsallack@landmarkcr.com
O: 717-731-1990
M: 717-829-4011
nsallack@landmarkcr.com
While we strive to provide the most accurate information, all listing information, and demographic data, is provided by third-parties. As such, MyEListing will not be responsible for the accuracy of the information. It is strongly recommended that you verify all information with the listing agent, and any relevant agencies, prior to making any decisions.